The video clipping market is rapidly developing, transforming from a simple video cutting tool into a powerful channel for advertising reach. A joint study by VibeVO, a video clipping platform, and Go Influence, an influencer agency, sheds light on the current state of the short video, video clipping, and social media banner advertising market, demonstrating how these formats are becoming key for brand promotion.
Short vertical videos have long ceased to be just entertainment. For companies, it is already an independent promotion environment. A single episode, interview, live broadcast, review, or conversational recording turns into a series of short videos, each of which can become a separate point of contact with the audience.
This study was prepared by VibeVO and Go Influence based on VibeVO data for the last 30 days as of June 8, 2026. The indicators describe the studied array of short videos and do not claim to evaluate the entire internet. However, the database is large enough to see the main patterns: concentration of views, differences in platforms, thematic cores, and audience within topics.
A brief version of the study is published on Sostav.
Key figures of the study
| Indicator | Value |
|---|---|
| Views in the saved 30-day volume | 252.81 million |
| Videos | 4,224 |
| Authors in the database | 141 |
| Pages in the database | 228 |
| Ad launches | 16 |
| Share of the three main topics | 86.1% |
| Audience coverage | 99.2% |
| Graphs from the updated table | 29 |
Main conclusion: the video clipping market can no longer be described only as mechanical video cutting. It is developing as a tool for managed advertising reach, where the topic, platform, author, release speed, design, placement environment safety, and result measurement are important. Banner advertising in social networks also changes its role: it works not separately from the video, but during viewing or next to it.
Why short video has become a mass format
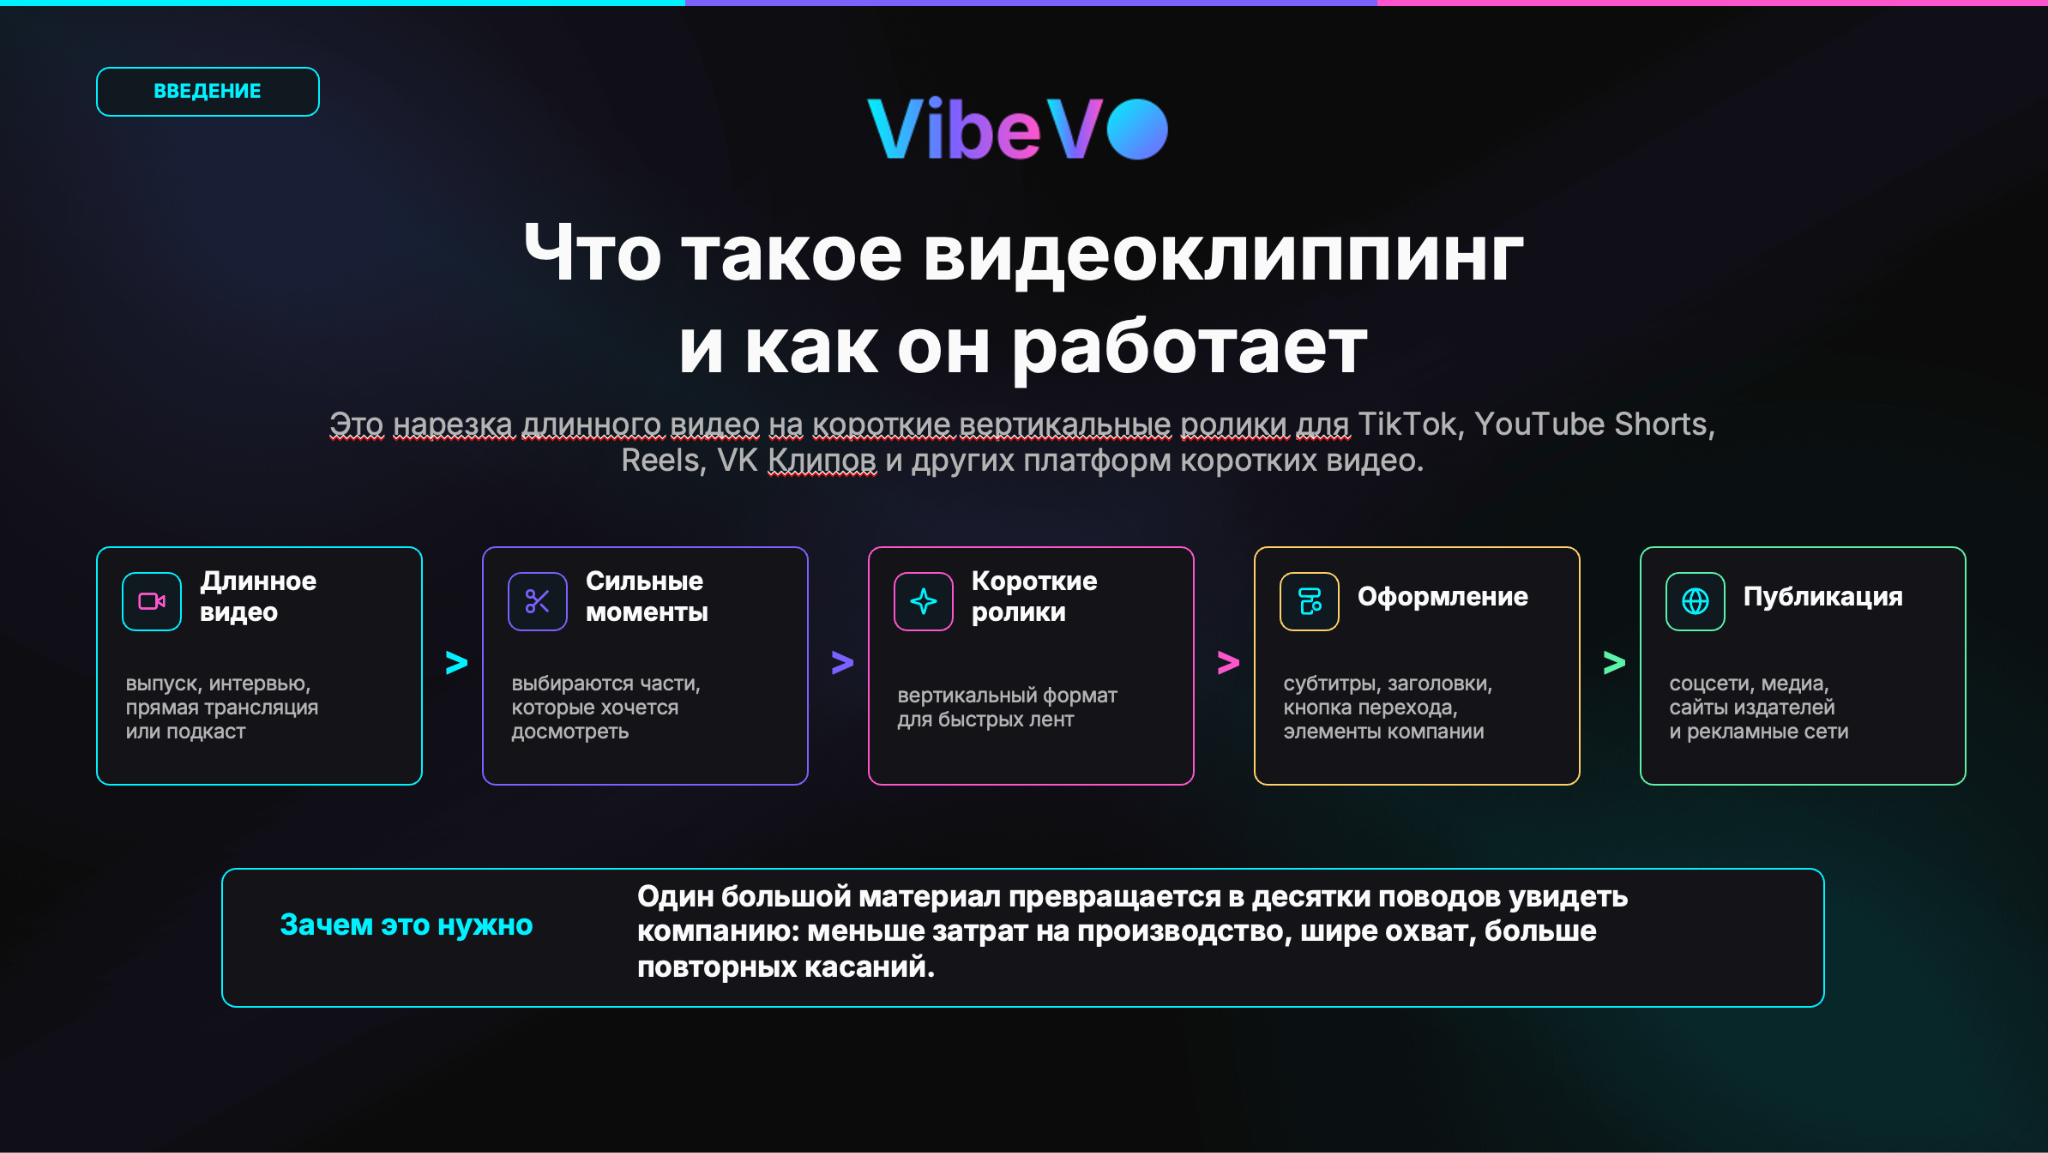
Video clipping is the transformation of long material into short vertical videos for recommendation feeds and author publications. The original video is broken down into strong moments, each fragment receives subtitles, a title, design elements, and a clear next step: go, save, watch to the end, take advantage of an offer, or learn more.
The economics of this approach are simple: one large piece of content provides dozens of reasons to re-engage with the audience. Instead of a one-off release, a company gets a series of repeated touchpoints, and platforms get content that is easier to distribute in fast feeds. Therefore, video clips are becoming not an auxiliary technique, but a separate way to buy attention.
External benchmarks in the presentation show why this shift has become widespread:

- TikTok users spend an average of 95 minutes per day on the app.
- YouTube Shorts collect over 200 billion views per day.
- Instagram* is stated as a platform with 3 billion monthly users.
- Video advertising spending on the internet in the US exceeds 80 billion dollars.
Even if markets and platforms differ by country, the logic of consumption itself is already obvious: attention has shifted to short videos.
Source: VibeVO data, updated 08.06.2026. Click on the chart to open it in full size.
Overall picture: topics and platforms
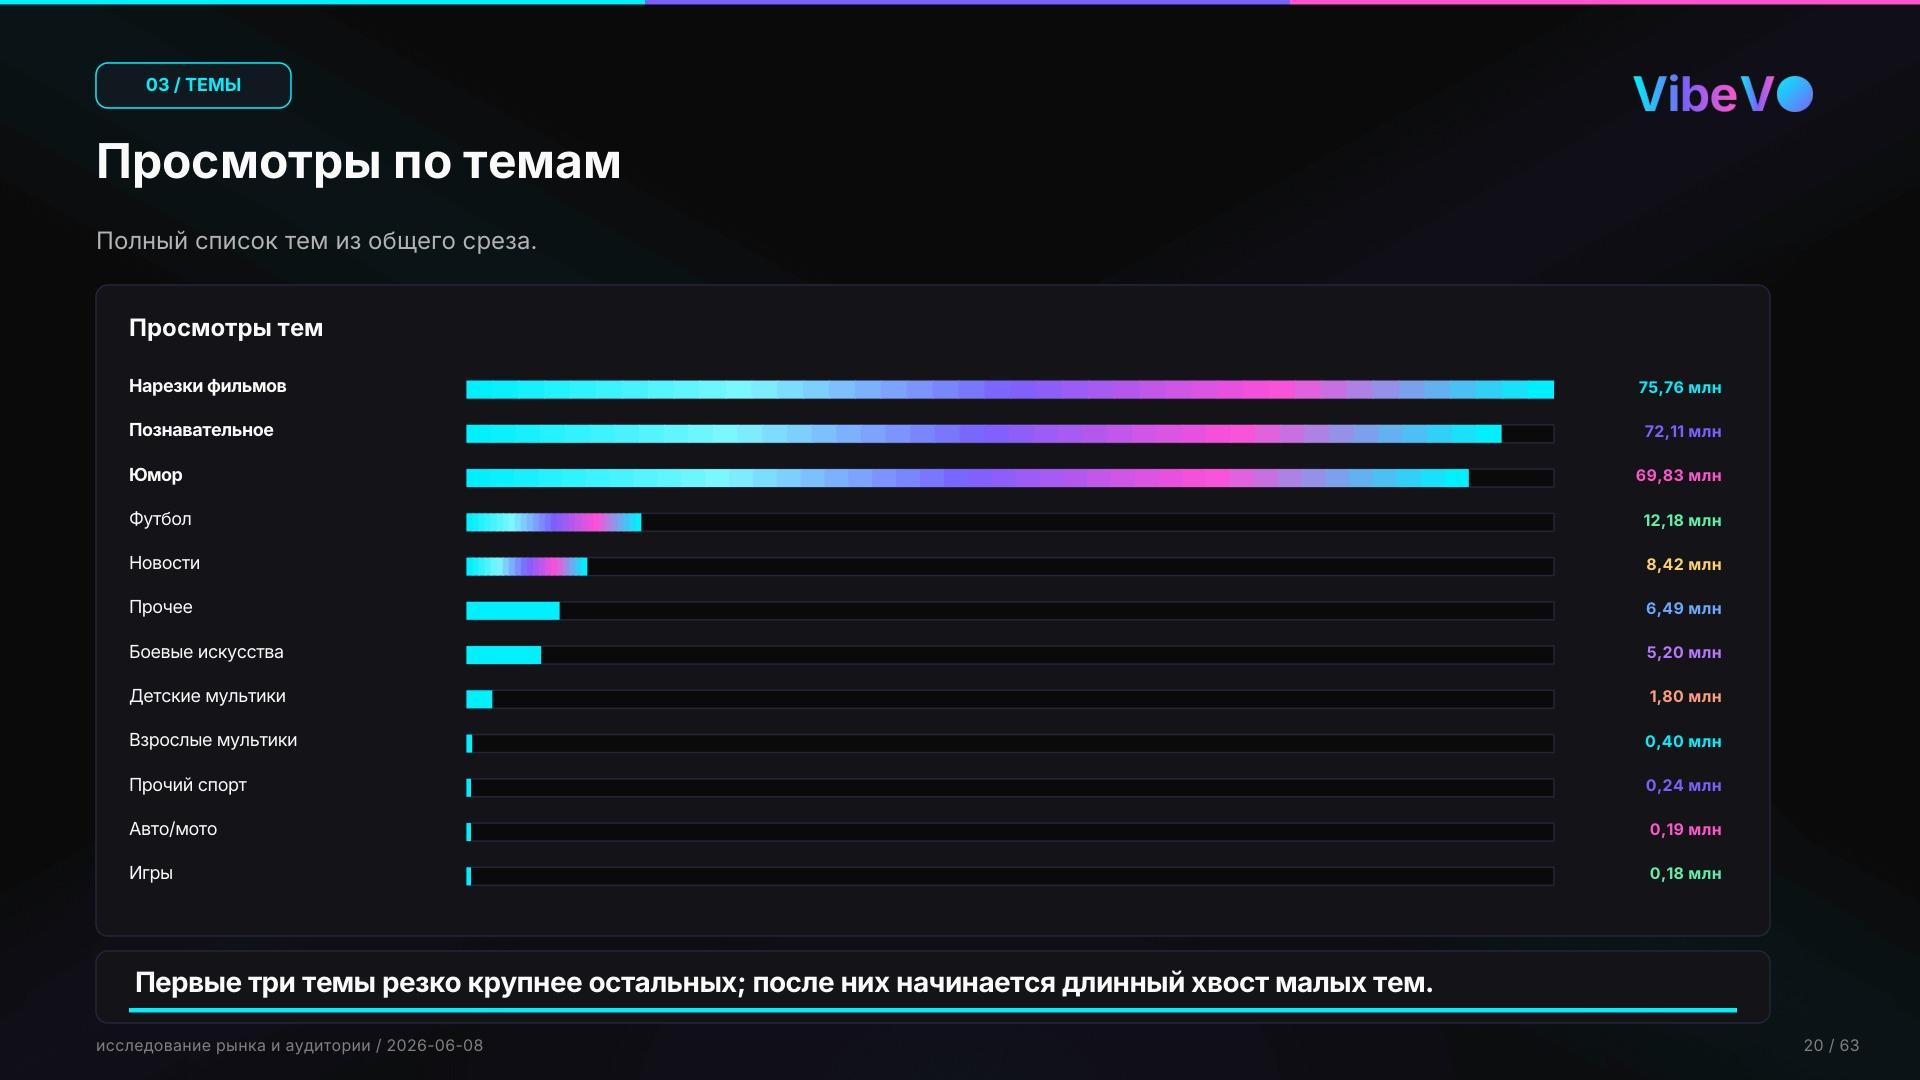
In the updated cut, the market looks concentrated. The three largest topics — movie clips, educational videos, and humor — account for 86.1% of the saved volume. Movie clips garnered 75.76 million views in 30 days, or 30.0%. Educational videos yielded 72.11 million views, which is 28.5%. Humor is almost at the same level: 69.83 million views, or 27.6%.
After the top three, a long tail begins: football — 12.18 million views, news — 8.42 million, other topics — 6.49 million, martial arts — 5.20 million. Children’s and adult cartoons, other sports, auto and moto, games are significantly less represented in the studied cut. This is an important caveat for placements: small topics cannot be generalized by the same rules as the largest ones.

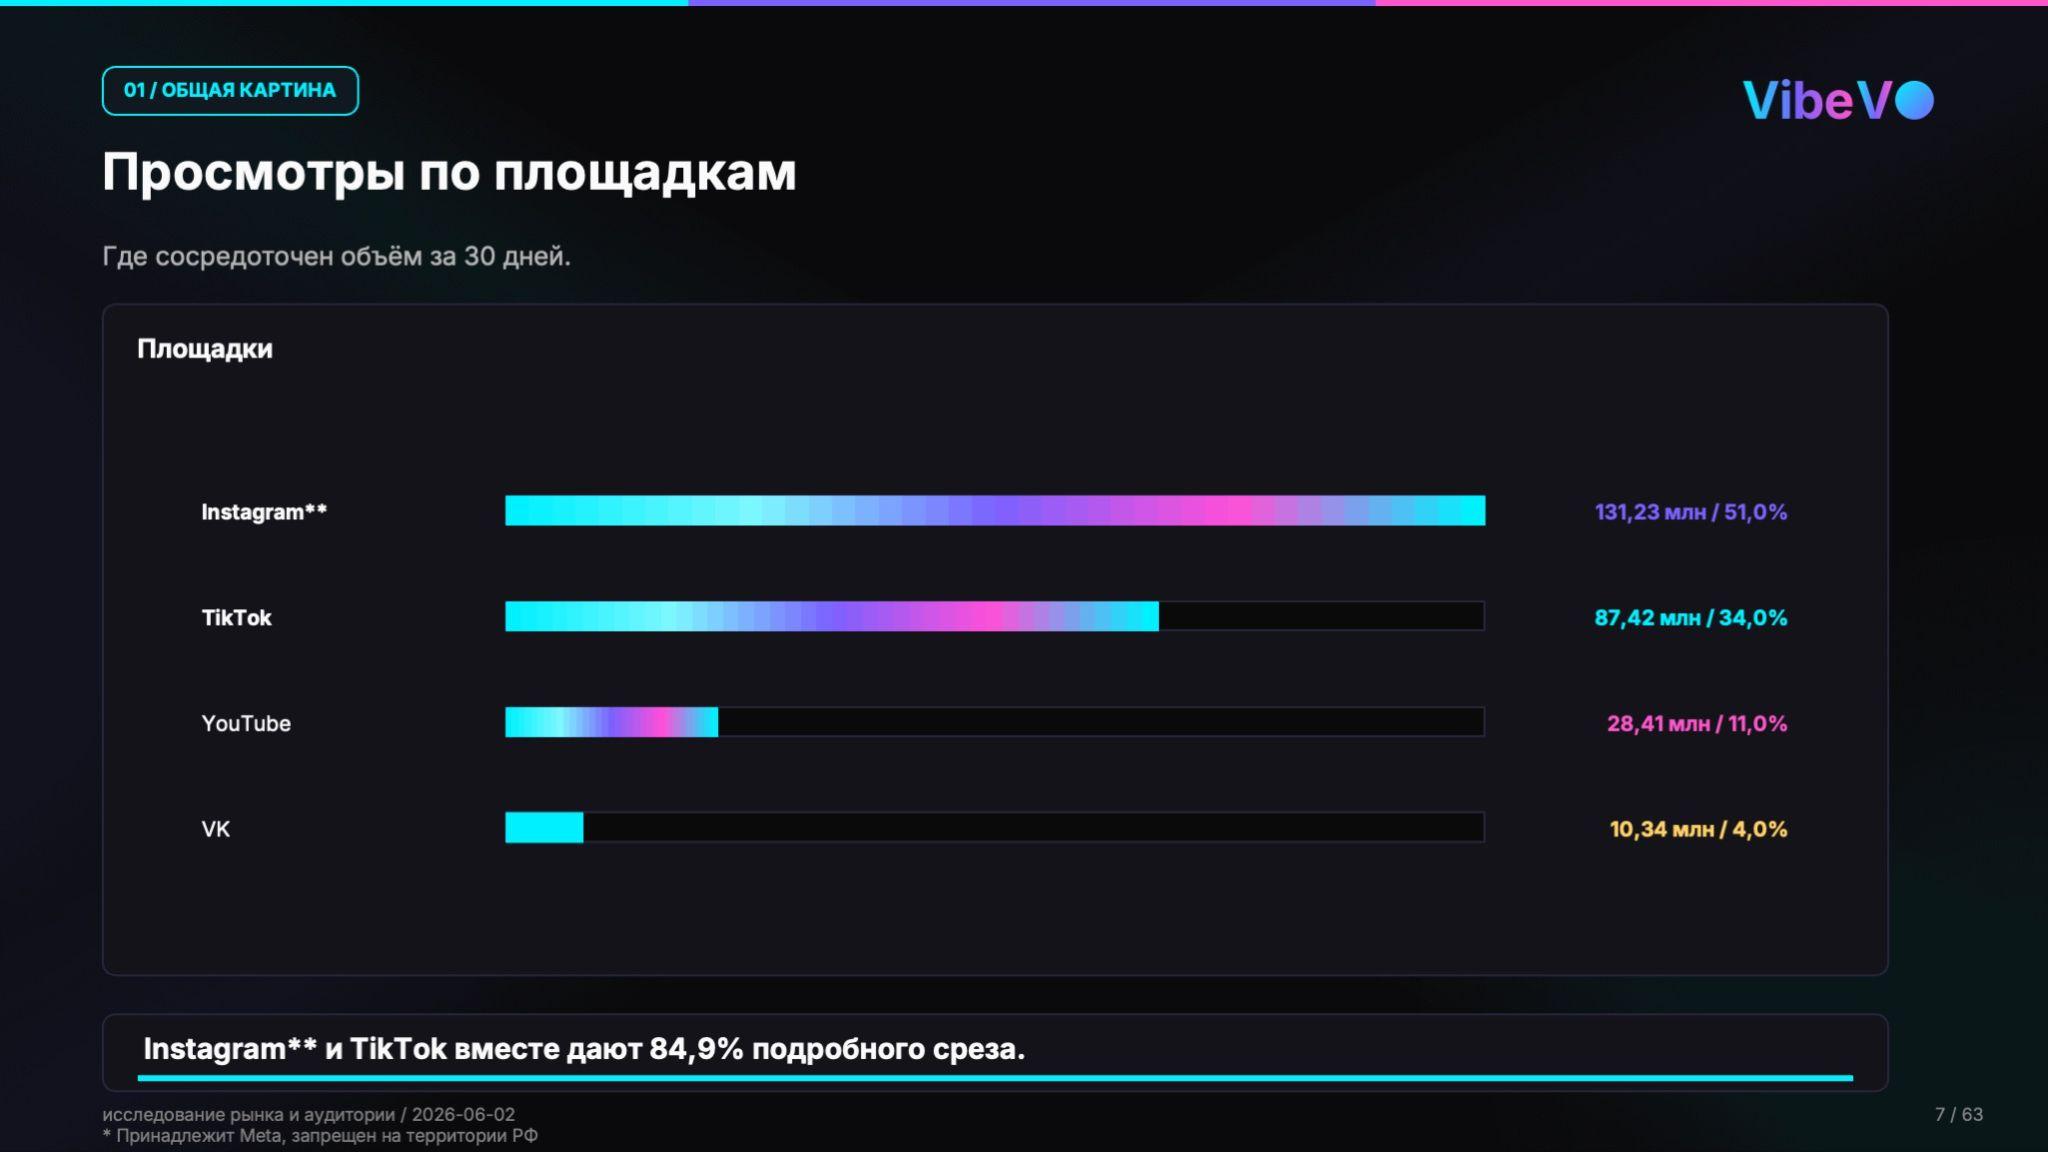
By platforms, Instagram* became the leader: 131.23 million views, or 51.0% of the detailed volume. TikTok yielded 87.42 million views, or 34.0%. Together, they form 84.9% of the detailed cut, but other platforms do not disappear: they can be important for individual topics, creators, and strong publications.
Source: VibeVO data, updated 08.06.2026. Click on the chart to open it in full size.
Source: VibeVO data, updated 08.06.2026. Click on the chart to open it in full size.
Database size and strength of individual platforms
The database includes 4,224 videos with an active topic, 141 authors, 228 pages, and 16 advertising campaigns. This allows us to look not only at the overall volume but also at how platforms behave differently. Some provide scale, while others provide a stronger upper part of publications.
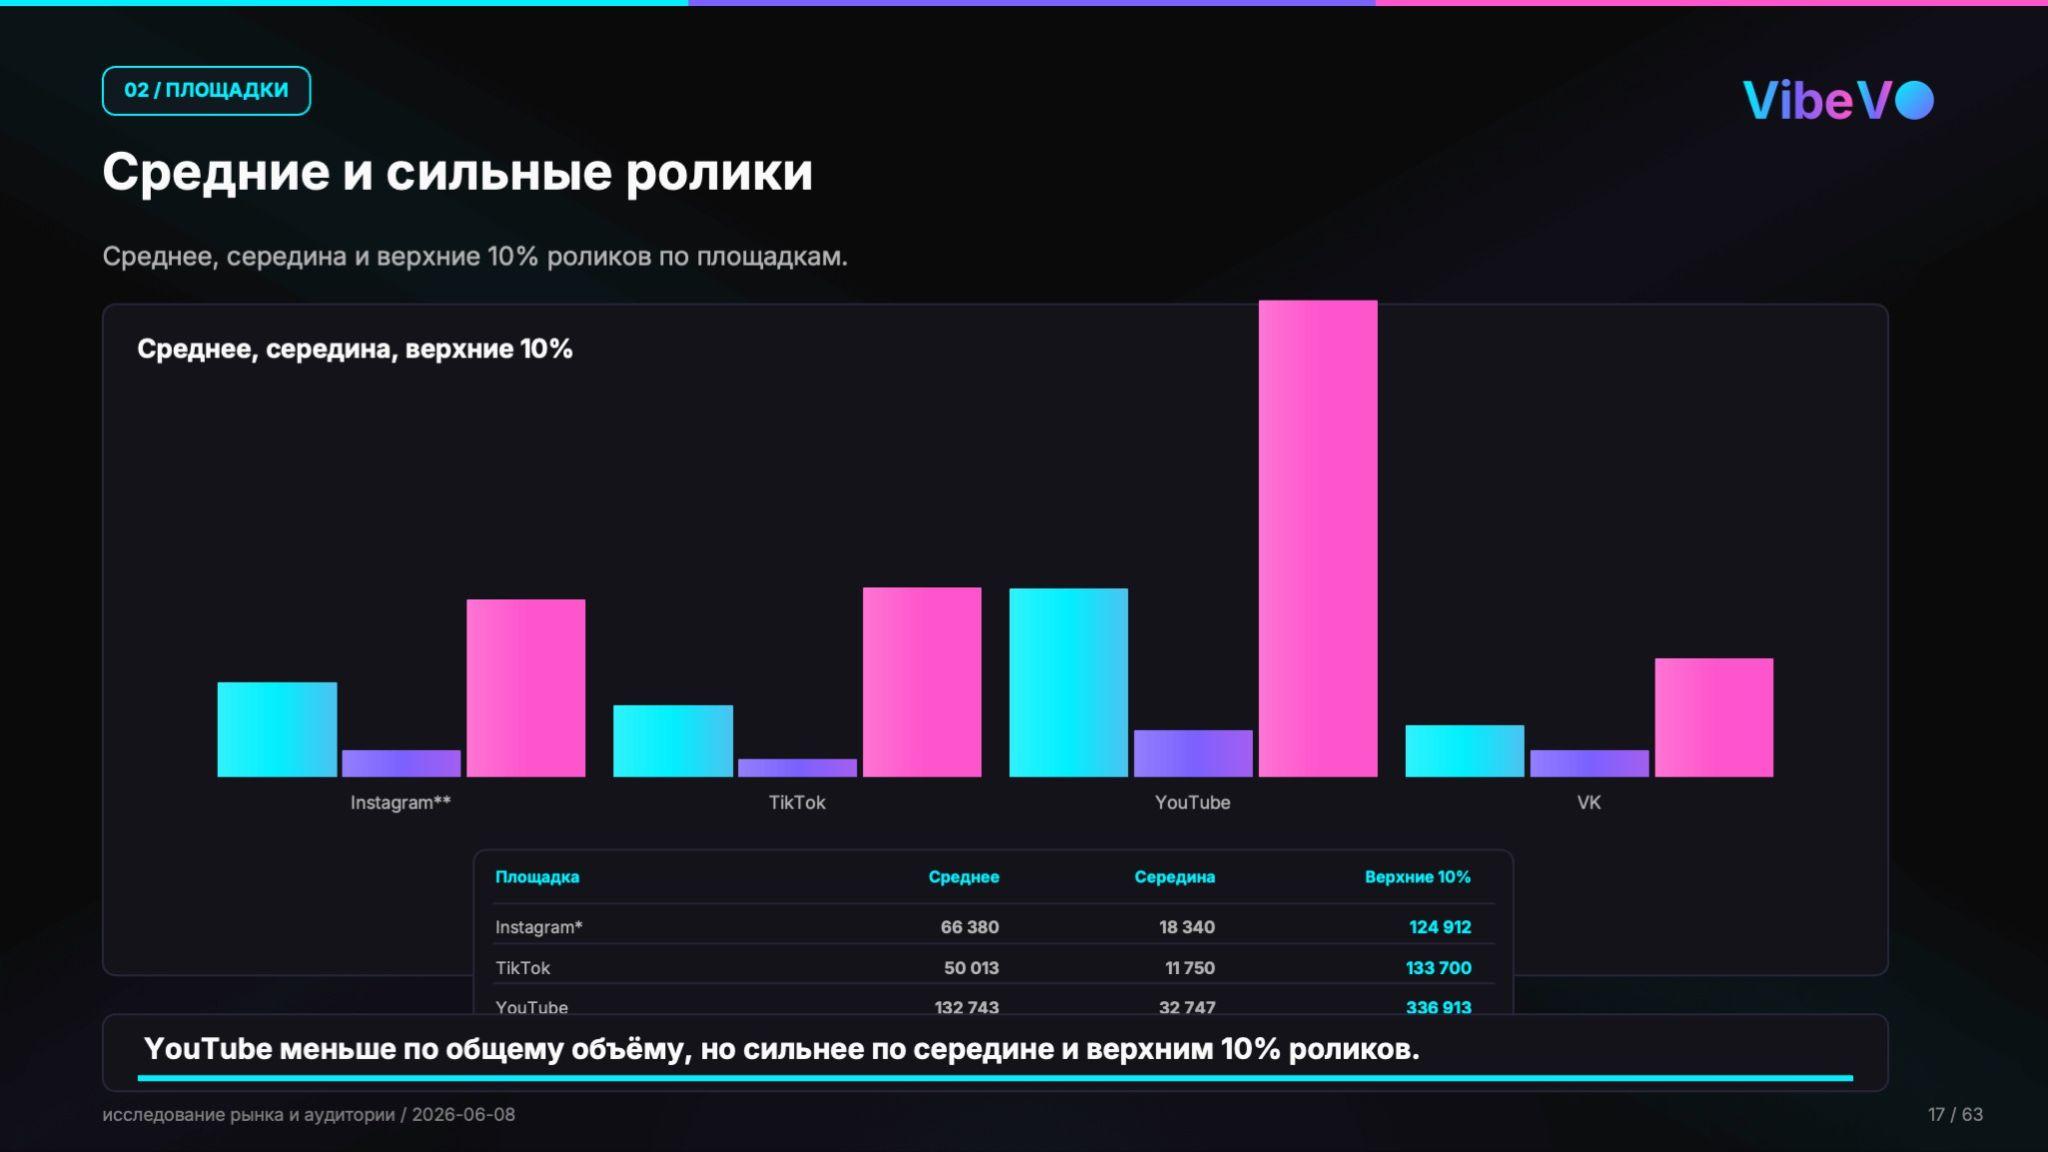
Instagram* leads in overall volume, but YouTube’s algorithms react more sharply to viral videos and give them a larger share of reach. On average, one video on YouTube received 132,743 views. For Instagram*, the average was 66,380, and for VK, it was 36,277.
Such a distribution changes the placement plan. Mass reach is logically sought in large Instagram* and TikTok bundles, but if there is viral content, YouTube can be a platform where it is easier to gain reach.

Source: VibeVO data, updated 08.06.2026. Click on the chart to open it in full size.
It is better to analyze topics in bundles: topic plus platform
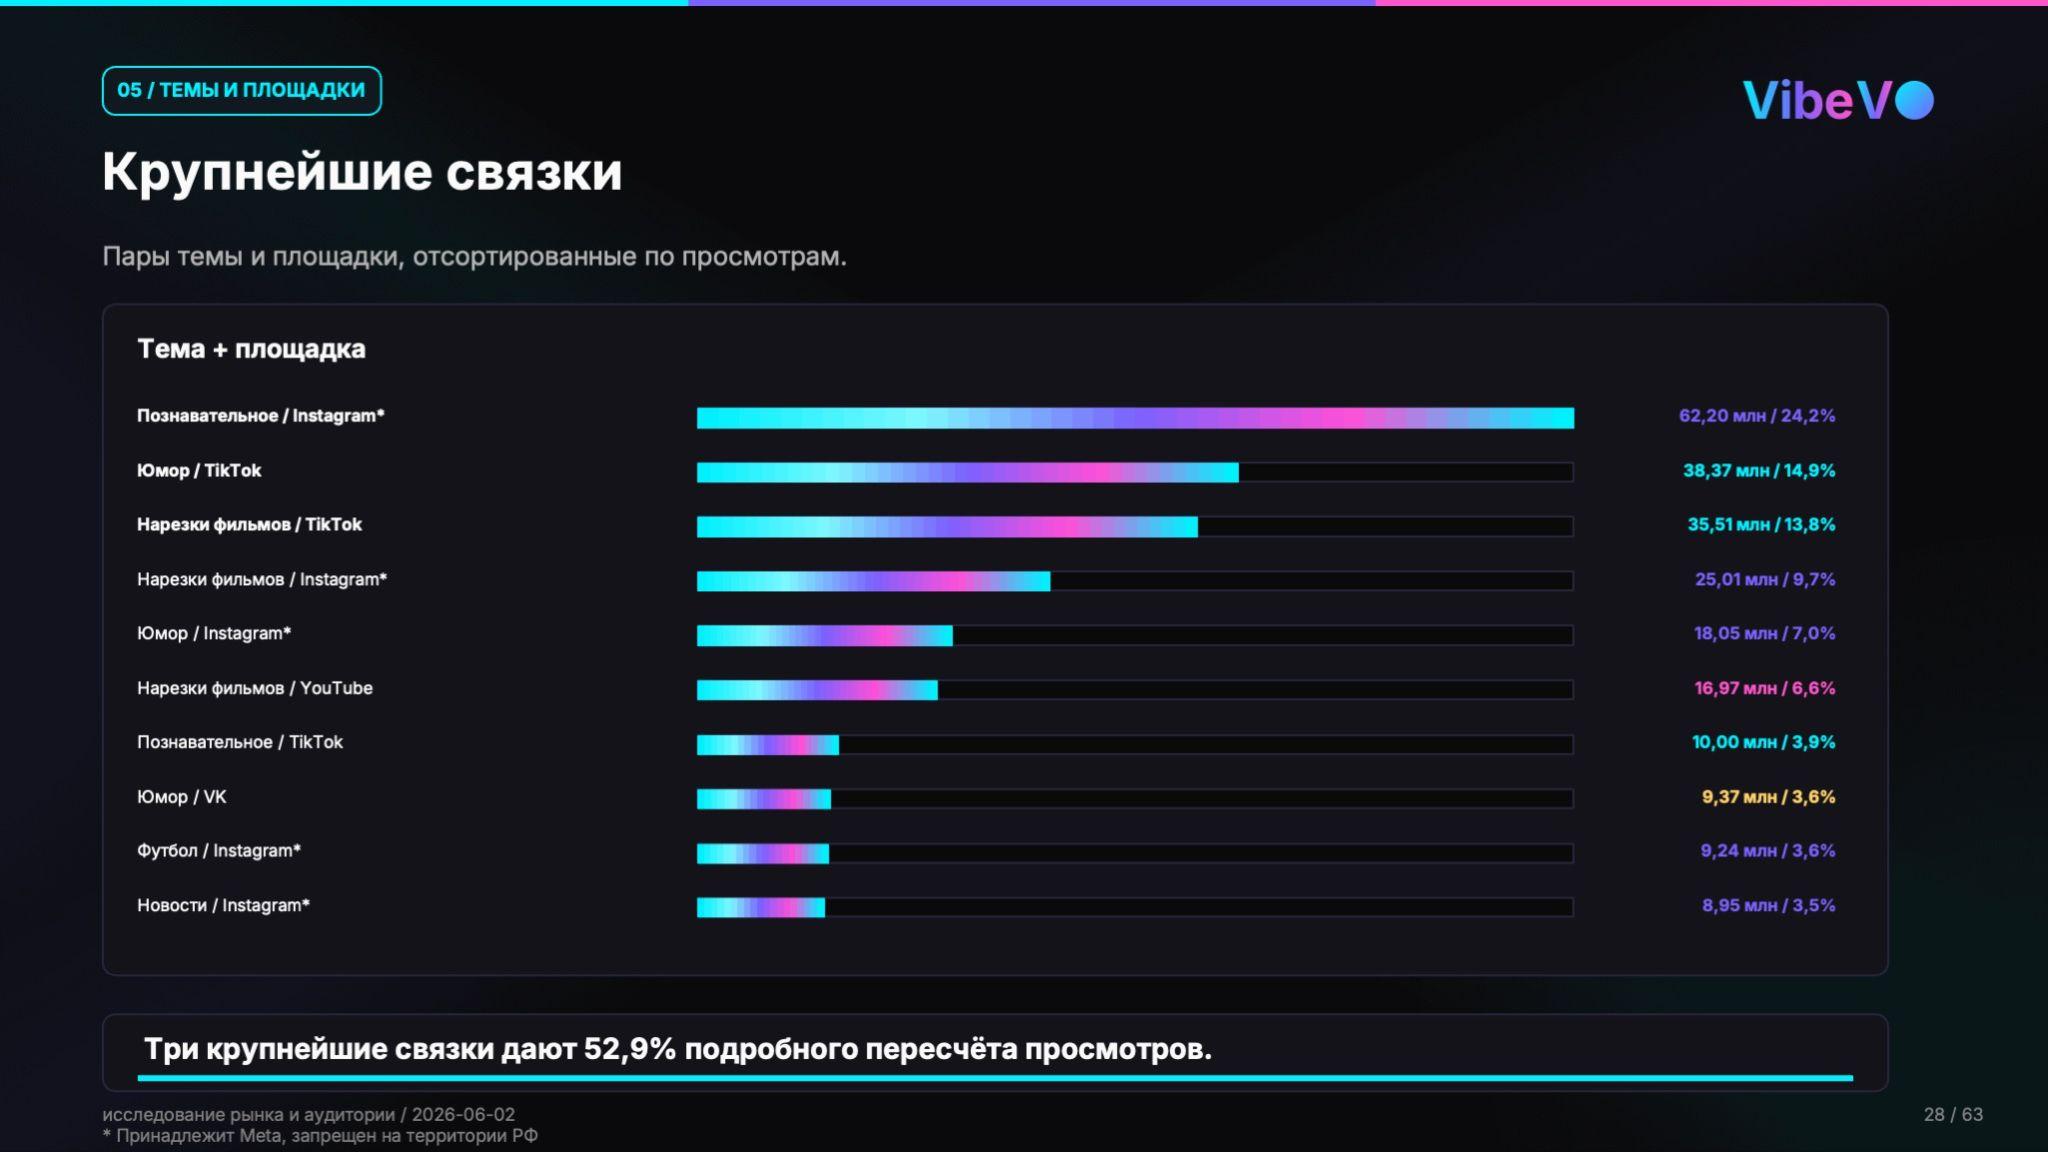
The total volume across the platform does not fully explain the market. The largest reach points occur where the topic and the distribution medium coincide. In the updated data, the largest combination is educational videos on Instagram*: 62.20 million views, or 24.2% of the detailed recalculation. This is followed by humor on TikTok – 38.37 million views, or 14.9%, and movie clips on TikTok – 35.51 million views, or 13.8%.
The three largest combinations account for 52.9% of the detailed recalculation of views.
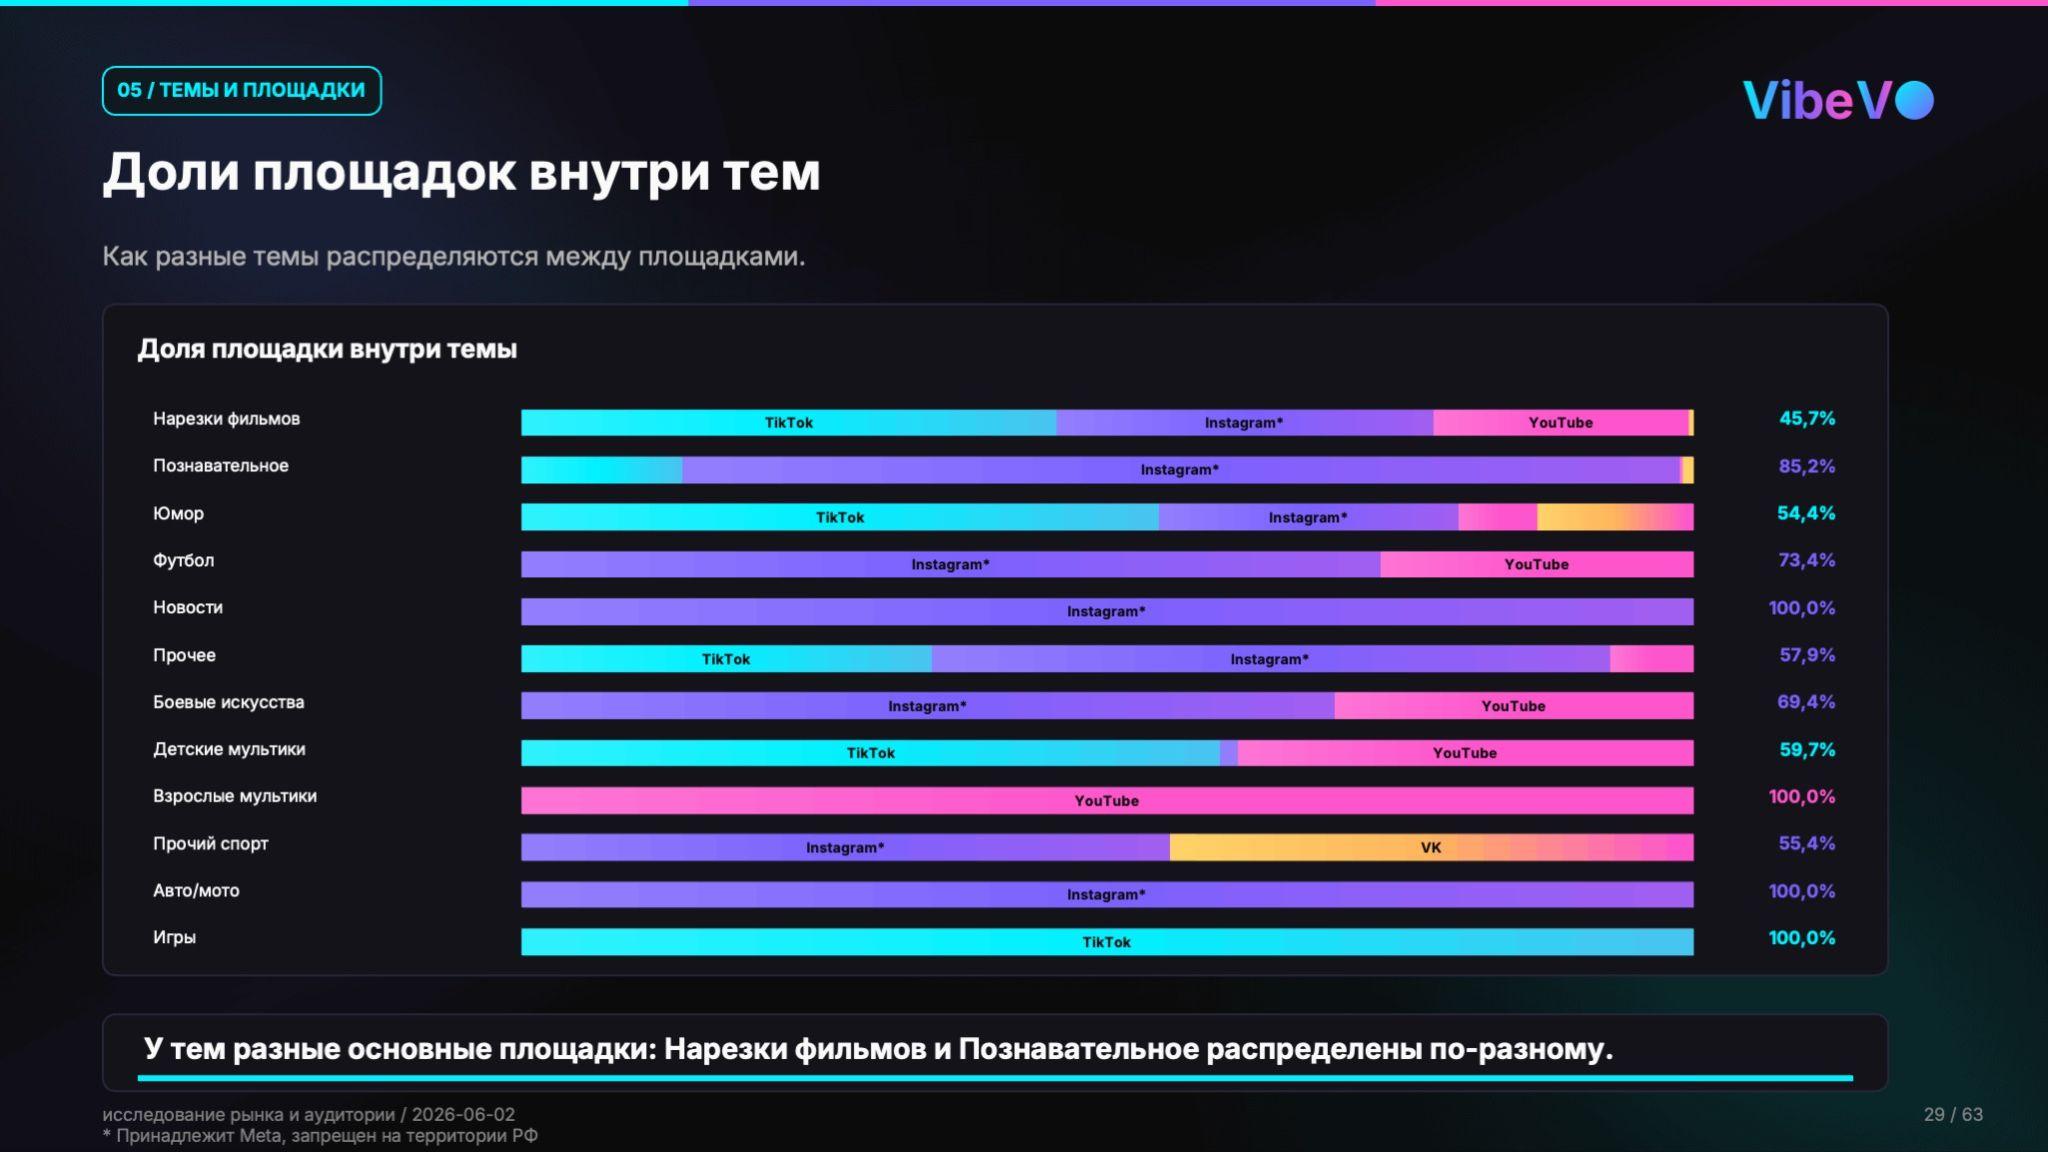
That is why video clipping cannot be launched using a single general grid for all tasks. For educational videos, auto/moto, Instagram* works better; humor, games, and movie clips rely heavily on TikTok; adult cartoons rely on YouTube. Different topics require different platforms, creators, and designs.

Source: VibeVO data, updated 08.06.2026. Click on the chart to open it in full size.
Source: VibeVO data, updated 08.06.2026. Click on the chart to open it in full size.
Views are sharply distributed: the top portion of videos yields results
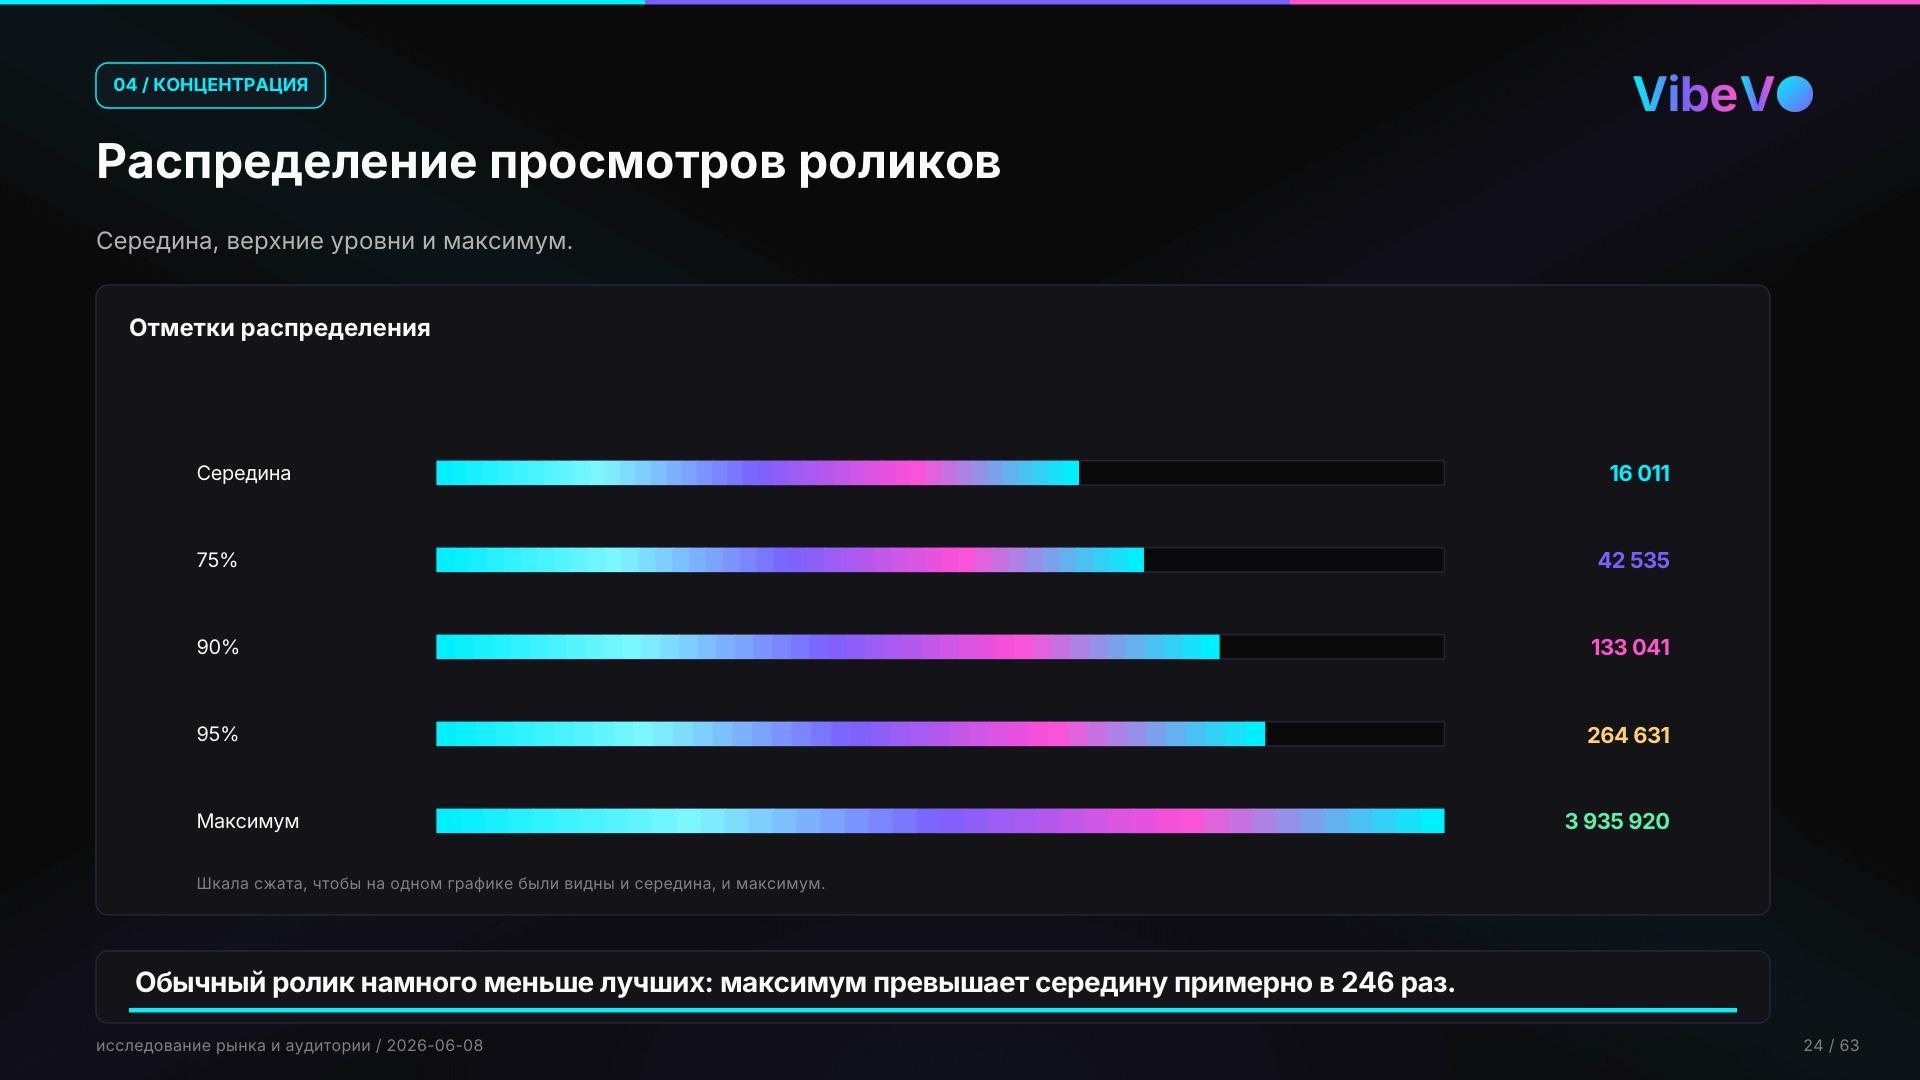
In short feeds, the average result hides a very strong unevenness. The average number of views is 16,011 views over 30 days. The 75th percentile is 42,535 views, the 90th percentile is 133,041. The maximum video garnered 3,935,920 views, which is approximately 246 times more than the median. As expected, the distribution is very uneven.
Even more illustrative is the share of the best publications. The top 10 videos generated 23.88 million views, or 9.3% of the volume. The top 50 videos – 62.48 million, or 24.3%. The top 10% of videos collected 165.54 million views, or 64.3% of all views. In other words, most views are generated by the top 5% of videos.
A practical conclusion for advertising in video clipping: you cannot rely on a single video. You need a set of video clips with different first seconds, titles, subtitles, overlays, and advertising message options. It’s not just the most beautiful video that wins, but a series of attempts where the best publications quickly gain more weight.
Leave a Reply