Tag: digital advertising

  • ChatGPT Ads: 6 Months Later — What is a Good CPM?

    ChatGPT Ads: 6 Months Later — What is a Good CPM?

    Six months after the launch of OpenAI’s advertising platform, ChatGPT Ads still raises questions among advertisers. The figures vary widely: cost per click (CPC) ranges from less than $3 to $13, and a profitable CPM is not always clear. Some campaigns bring quality leads at a competitive price, while others yield minimal results. The problem is that there are no clear criteria for evaluating effectiveness, and the platform’s reporting is limited.

    Reporting is available at the campaign, ad group, and ad levels. Conversion tracking is implemented through OpenAI Pixel and Conversions API, supporting actions such as purchases, leads, and registrations. OpenAI can also use modeled conversions. This is where the reporting functionality ends, which complicates price comparison and the assessment of real ROI.

    Reporting Limitations and Competition

    The lack of comprehensive competitive reporting is a critical issue. If CPC increases, current data does not allow understanding whether this is due to increased competition, changes in relevance, inventory volume, bids, or the types of dialogues in which ads appear.

    This hinders accurate cheap hypothesis testing and campaign optimization.

    Hostinger’s Experience: $70,000 on Tests

    One of the largest public tests was conducted by Hostinger, spending almost $70,000. Hussein Ograk, Head of PPC, initially noted that CPC was no higher than in Google Search, and campaigns generated purchases. However, as the budget increased, his assessment became more nuanced.

    “CPM exceeded $65, but the main problem was CTR. More specific cases worked better, while broad messages consistently failed. Traffic quality was unstable, and evaluating ROAS based solely on direct conversions proved difficult,” Ograk noted.

    This example demonstrates that what CPM to consider profitable is a matter of context and traffic quality.

    Other Tests: Attribution and Lead Quality

    CTC reported attributed revenue ranging from $19,000 to $38,000, depending on the attribution model, with ROAS from 3.3x to 6.8x. They used Triple Whale to assess downstream performance, as ChatGPT Ads reports were insufficient.

    Floyd Blakey, analyzing a B2B campaign with a budget of $7,000 CAD, recorded an average CPC of $9.29, CPM of $64.34, and CTR of 0.7%. Using visitor de-anonymization, her team identified 146 organizations from 336 paid clicks. Of these, only five matched the ideal customer profile.

    This highlights the problem of traffic quality and shows that cheaper than influencers does not always mean more effective.

    Geographical Differences and Recommended CPC

    The Synter test showed significant geographical differences. With an overall CPC of $9.89 (at $4,428.84), it ranged from $5.10 in the UK to $10.62 in the US. In Australia, CPC reached $17.59, in New Zealand — $22.89, although volumes there were significantly lower. Cost per click heavily depends on the region.

    OpenAI recommends a starting maximum CPC from to . However, this recommendation is often perceived as a benchmark, although it is not. This creates false expectations regarding a budget alternative to seeding and how much 1 million impressions cost via banner compared to AI advertising.

    ChatGPT Ads: 6 months later — what is a profitable CPM? — illustration 2

    ChatGPT Ads Audience

    Advertising in ChatGPT is only available to Free and Go plan users, who constitute the majority of the audience. More expensive subscriptions (Plus, Pro, Business, Enterprise, Edu) remain ad-free, as do accounts of minors. This means that the advertising audience does not coincide with the overall ChatGPT user base.

    There is insufficient public information about the demographics and purchasing power of this audience. General ChatGPT user statistics are also irrelevant, as they include those who do not see ads. Geography further narrows the comparison.

    • Pilot launch: USA, Canada, Australia, New Zealand (February).
    • Expansion: UK, Japan, South Korea, Brazil, Mexico (May-August).
    • Access to Ads Manager: 52 countries (August 31).

    How to Approach ChatGPT Ads Now

    When starting to test hypotheses cheaply on this platform, it is important to understand its current limitations. Set expectations before spending, based on what will make the channel profitable for your business. Someone else’s CPC or CTR will provide little value until we know so little about the competition, audience, and types of dialogues behind these results.

    Early results require more thorough analysis than on mature platforms. Due to a lack of diagnostic signals, it is difficult to distinguish a real performance problem from display peculiarities, relevance, or available dialogues during the test period. There is no universal number yet that determines the success of a campaign in ChatGPT Ads. “Good” is what the channel brings to your specific business, not abstract figures.

    Frequently Asked Questions

    What is a profitable CPM in ChatGPT Ads?

    A profitable CPM in ChatGPT Ads does not have a fixed value. It depends on the niche, traffic quality, campaign goals, and the ROI you receive. Hostinger’s experience showed a CPM above $65, but with CTR issues. It is important to evaluate not only CPM but also the quality of leads and the final ROAS.

    Is it worth investing in ChatGPT Ads for a cheap hypothesis test?

    ChatGPT Ads can be a tool for a cheap hypothesis test, but with caveats. Limited reporting requires additional analytics tools (e.g., Triple Whale, visitor de-anonymization) for a full evaluation. Be prepared for the price vs. result to vary greatly.

    What’s cheaper: banner ads or ChatGPT Ads?

    Comparing what’s cheaper: banner or blogger with ChatGPT Ads is not directly correct. CPC in ChatGPT Ads can be significantly higher than in traditional banner advertising, reaching $10-$20 in some regions. However, if the quality of traffic and ROAS justify these costs, then ChatGPT Ads can be more effective. It is important to calculate unit economics.

    What CPC should be considered normal for ChatGPT Ads?

    OpenAI recommends a starting maximum CPC of $3 to $5, but this is not a benchmark. The actual CPC can be significantly higher, up to $13-$22. A “normal” CPC is one that provides a positive ROAS and aligns with your unit economics. Do not rely solely on recommendations; always conduct a cheap hypothesis test and analyze your data.

    Conclusion

    ChatGPT Ads is a new platform with potential, but also with serious limitations, especially in terms of reporting and transparency. Advertisers accustomed to detailed statistics face the need for deep off-platform analytics to assess real effectiveness. To understand how much money each ruble spent will bring, do not rely on general figures, but focus on your metrics and goals.

    Conduct a cheap hypothesis test, analyze each stage of the funnel, and optimize campaigns based on your own data and expert opinions. This is the only way to find your profitable CPM and achieve success.

  • Video Clipping Market: Short Videos Become a New Channel for Advertising Reach

    Video Clipping Market: Short Videos Become a New Channel for Advertising Reach

    The video clipping market is rapidly developing, transforming from a simple video cutting tool into a powerful channel for advertising reach. A joint study by VibeVO, a video clipping platform, and Go Influence, an influencer agency, sheds light on the current state of the short video, video clipping, and social media banner advertising market, demonstrating how these formats are becoming key for brand promotion.

    Short vertical videos have long ceased to be just entertainment. For companies, it is already an independent promotion environment. A single episode, interview, live broadcast, review, or conversational recording turns into a series of short videos, each of which can become a separate point of contact with the audience.

    This study was prepared by VibeVO and Go Influence based on VibeVO data for the last 30 days as of June 8, 2026. The indicators describe the studied array of short videos and do not claim to evaluate the entire internet. However, the database is large enough to see the main patterns: concentration of views, differences in platforms, thematic cores, and audience within topics.

    A brief version of the study is published on Sostav.

    Key figures of the study

    Indicator Value
    Views in the saved 30-day volume 252.81 million
    Videos 4,224
    Authors in the database 141
    Pages in the database 228
    Ad launches 16
    Share of the three main topics 86.1%
    Audience coverage 99.2%
    Graphs from the updated table 29

    Main conclusion: the video clipping market can no longer be described only as mechanical video cutting. It is developing as a tool for managed advertising reach, where the topic, platform, author, release speed, design, placement environment safety, and result measurement are important. Banner advertising in social networks also changes its role: it works not separately from the video, but during viewing or next to it.

    Why short video has become a mass format

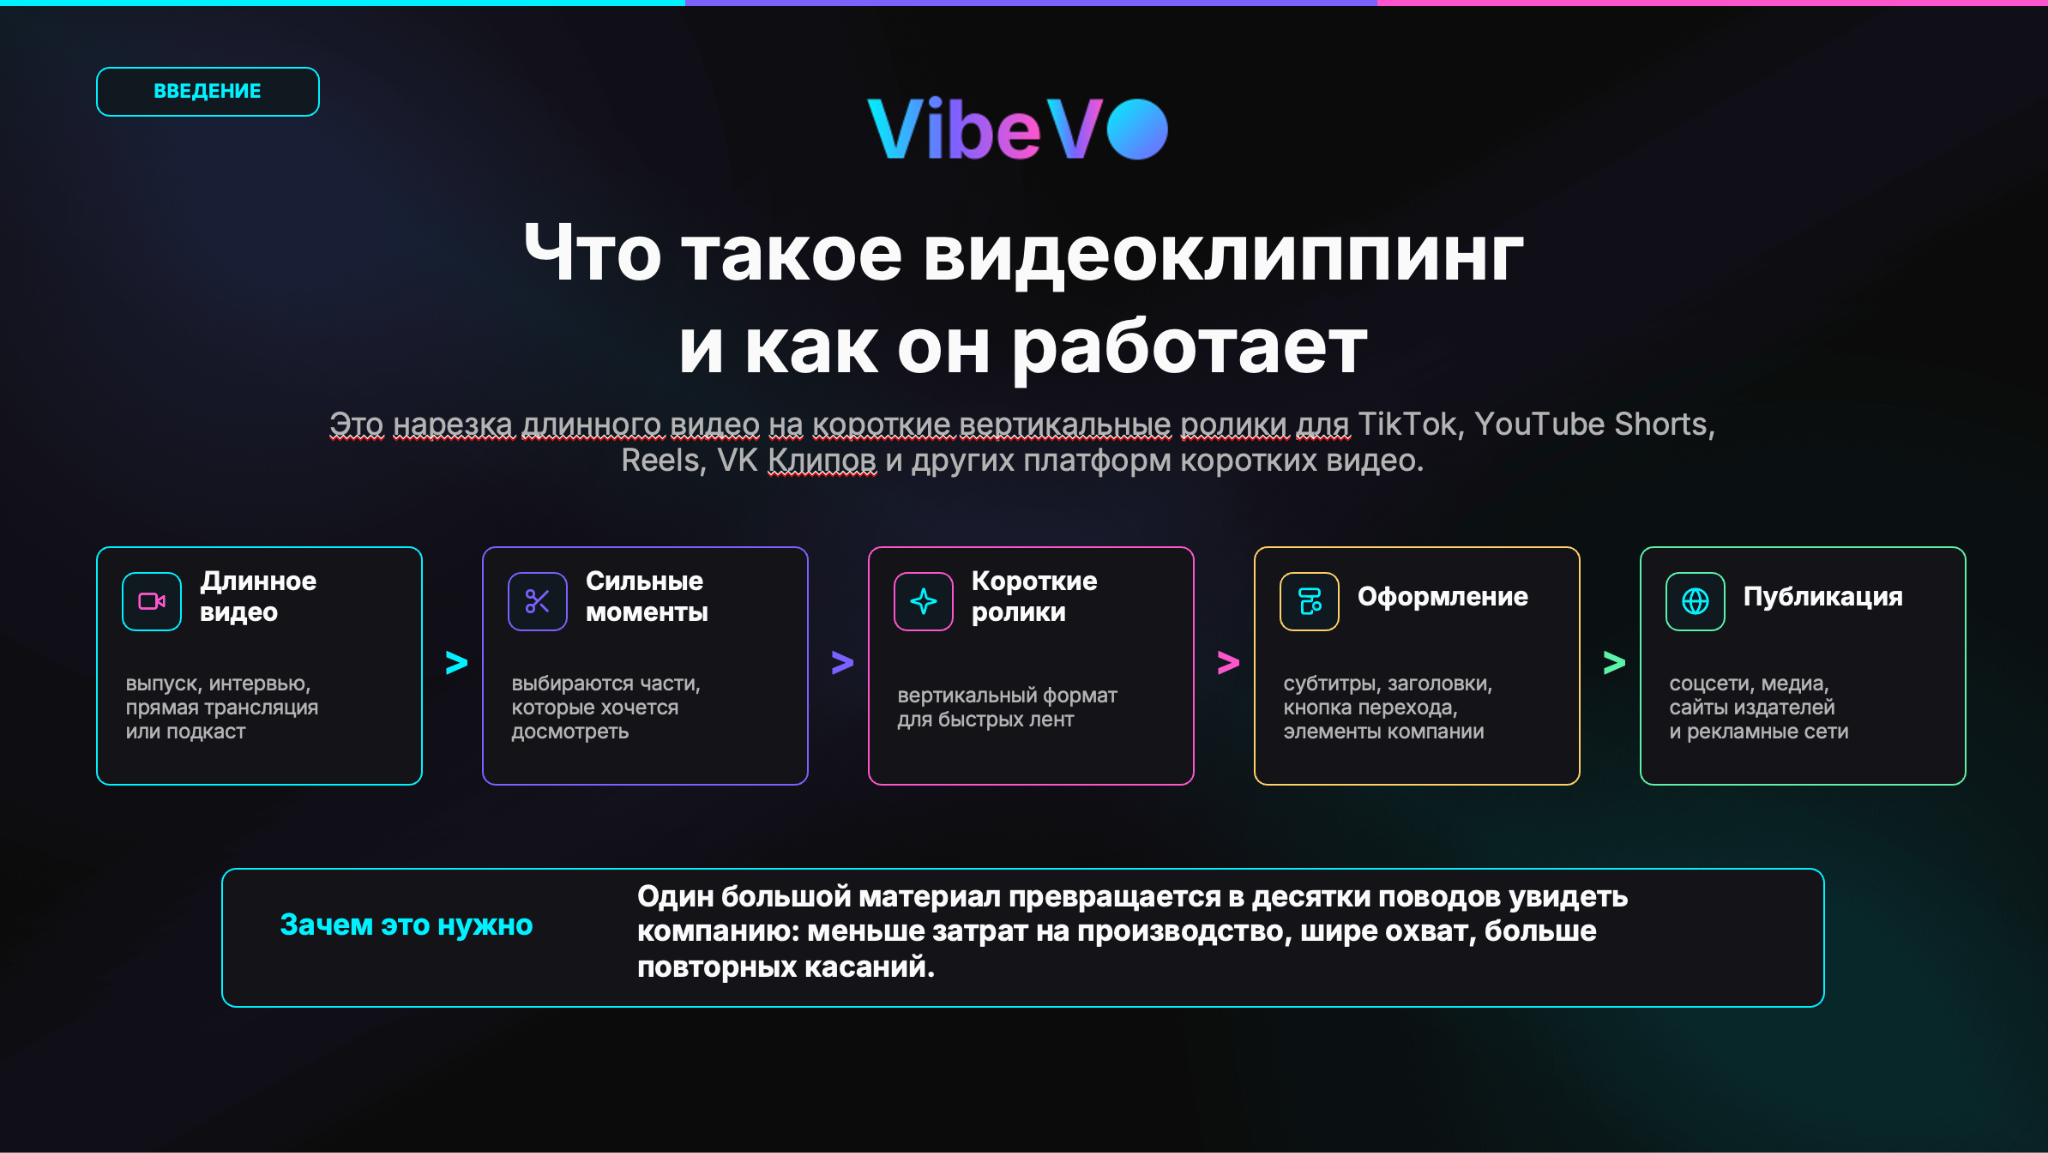
    Video clipping is the transformation of long material into short vertical videos for recommendation feeds and author publications. The original video is broken down into strong moments, each fragment receives subtitles, a title, design elements, and a clear next step: go, save, watch to the end, take advantage of an offer, or learn more.

    The economics of this approach are simple: one large piece of content provides dozens of reasons to re-engage with the audience. Instead of a one-off release, a company gets a series of repeated touchpoints, and platforms get content that is easier to distribute in fast feeds. Therefore, video clips are becoming not an auxiliary technique, but a separate way to buy attention.

    External benchmarks in the presentation show why this shift has become widespread:

    Illustration 1

    Even if markets and platforms differ by country, the logic of consumption itself is already obvious: attention has shifted to short videos.

    How video clipping works: the path from a long episode to a series of short videos
    Chart 1. How video clipping works: the path from a long episode to a series of short videos.
    Source: VibeVO data, updated 08.06.2026. Click on the chart to open it in full size.

    Overall picture: topics and platforms

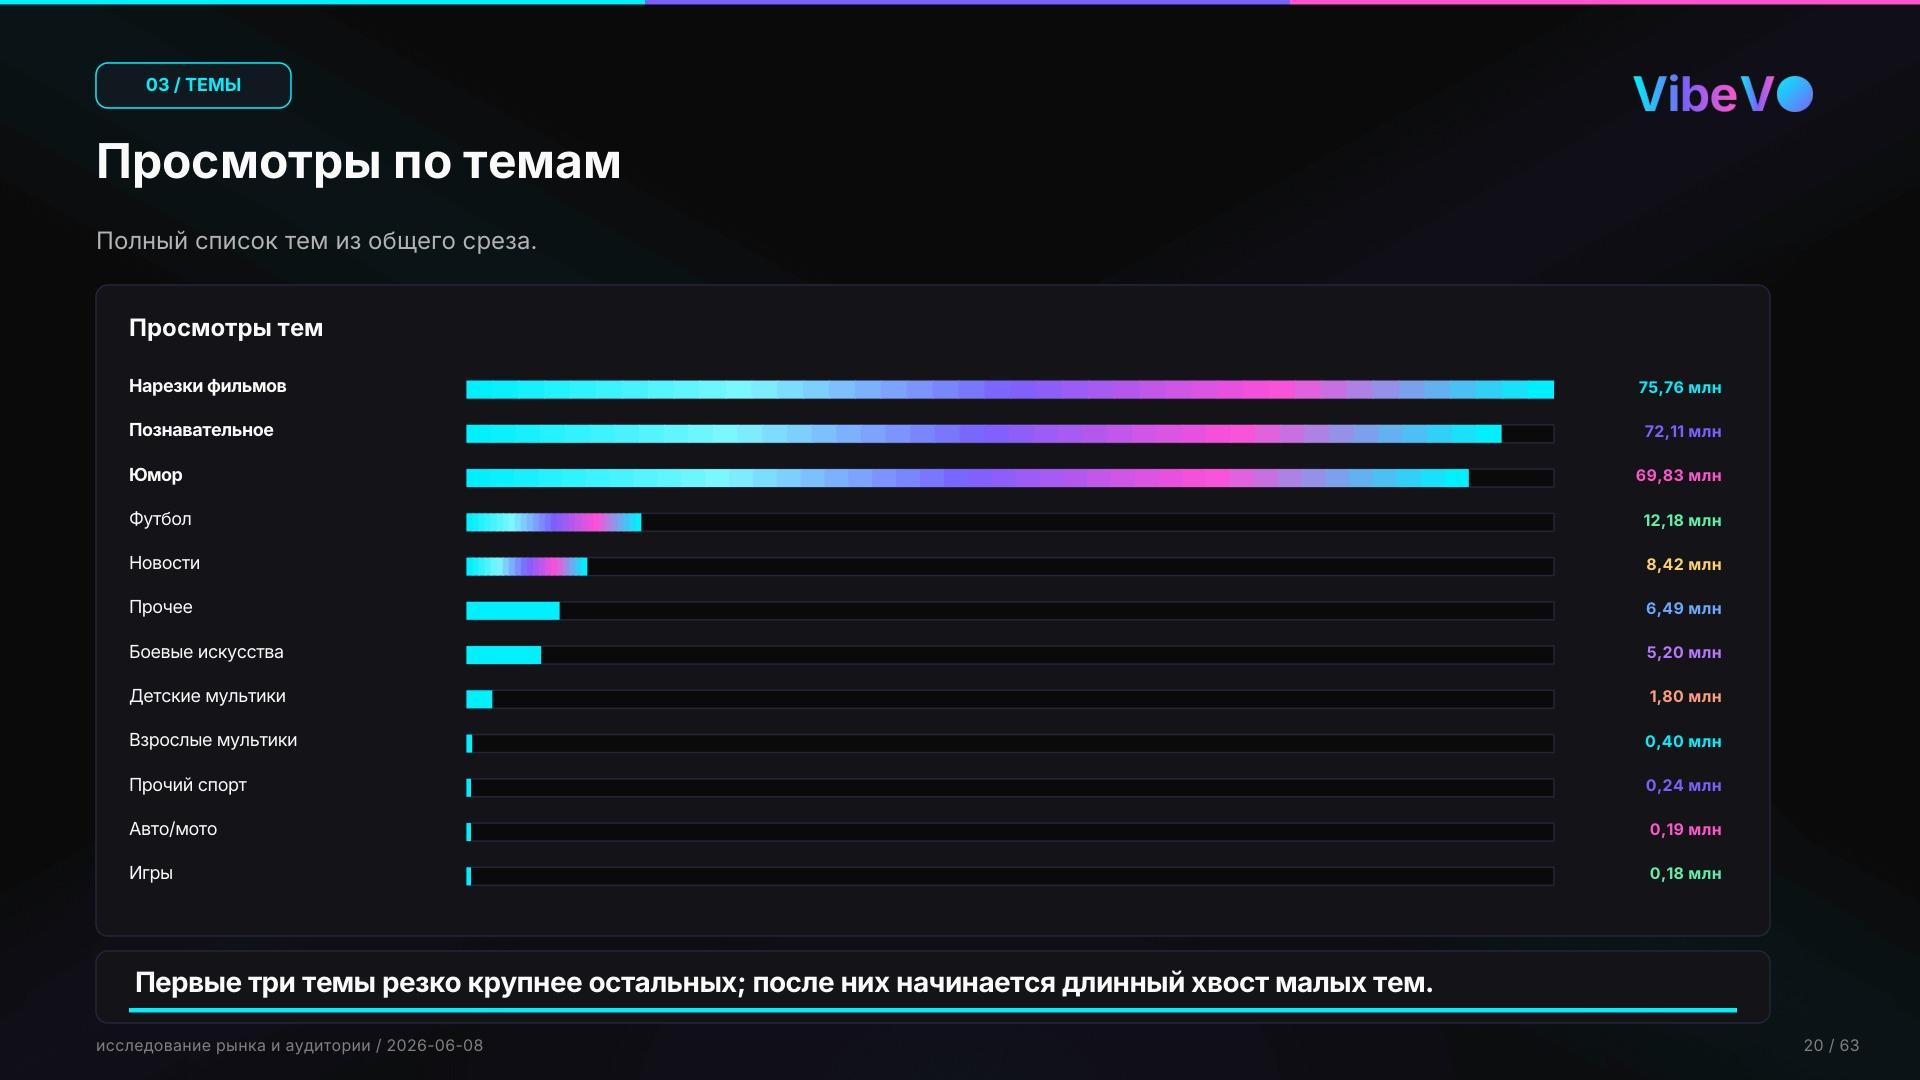
    In the updated cut, the market looks concentrated. The three largest topics — movie clips, educational videos, and humor — account for 86.1% of the saved volume. Movie clips garnered 75.76 million views in 30 days, or 30.0%. Educational videos yielded 72.11 million views, which is 28.5%. Humor is almost at the same level: 69.83 million views, or 27.6%.

    After the top three, a long tail begins: football — 12.18 million views, news — 8.42 million, other topics — 6.49 million, martial arts — 5.20 million. Children’s and adult cartoons, other sports, auto and moto, games are significantly less represented in the studied cut. This is an important caveat for placements: small topics cannot be generalized by the same rules as the largest ones.

    Illustration 2

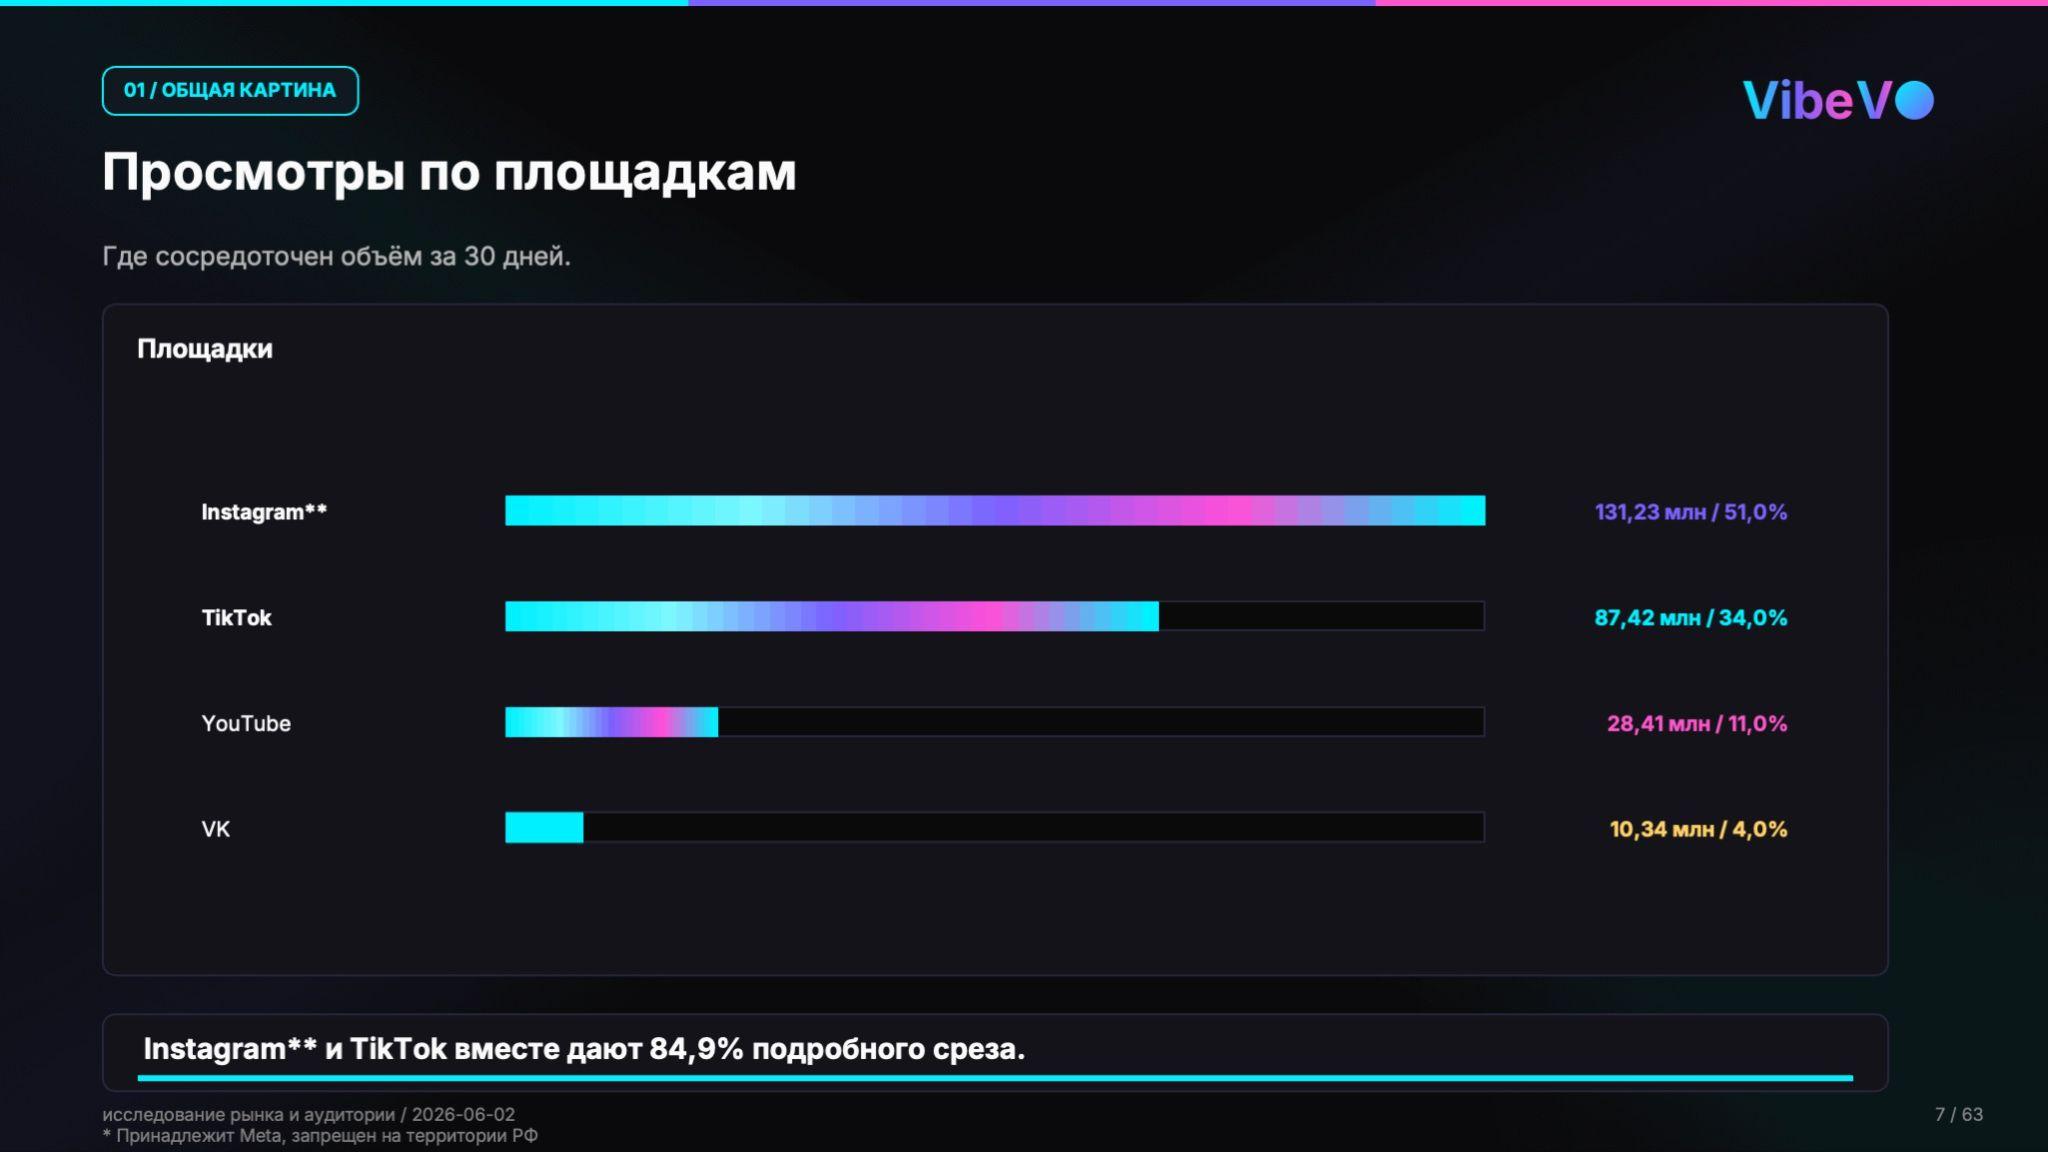
    By platforms, Instagram* became the leader: 131.23 million views, or 51.0% of the detailed volume. TikTok yielded 87.42 million views, or 34.0%. Together, they form 84.9% of the detailed cut, but other platforms do not disappear: they can be important for individual topics, creators, and strong publications.

    Просмотры по темам за 30 дней: три крупнейшие темы резко крупнее остальных
    Chart 2. Views by topic over 30 days: the three largest topics are significantly larger than the rest.
    Source: VibeVO data, updated 08.06.2026. Click on the chart to open it in full size.
    Просмотры по площадкам: Instagram* и TikTok формируют основную массу просмотров
    Chart 3. Views by platform: Instagram* and TikTok form the bulk of views.
    Source: VibeVO data, updated 08.06.2026. Click on the chart to open it in full size.

    Database size and strength of individual platforms

    The database includes 4,224 videos with an active topic, 141 authors, 228 pages, and 16 advertising campaigns. This allows us to look not only at the overall volume but also at how platforms behave differently. Some provide scale, while others provide a stronger upper part of publications.

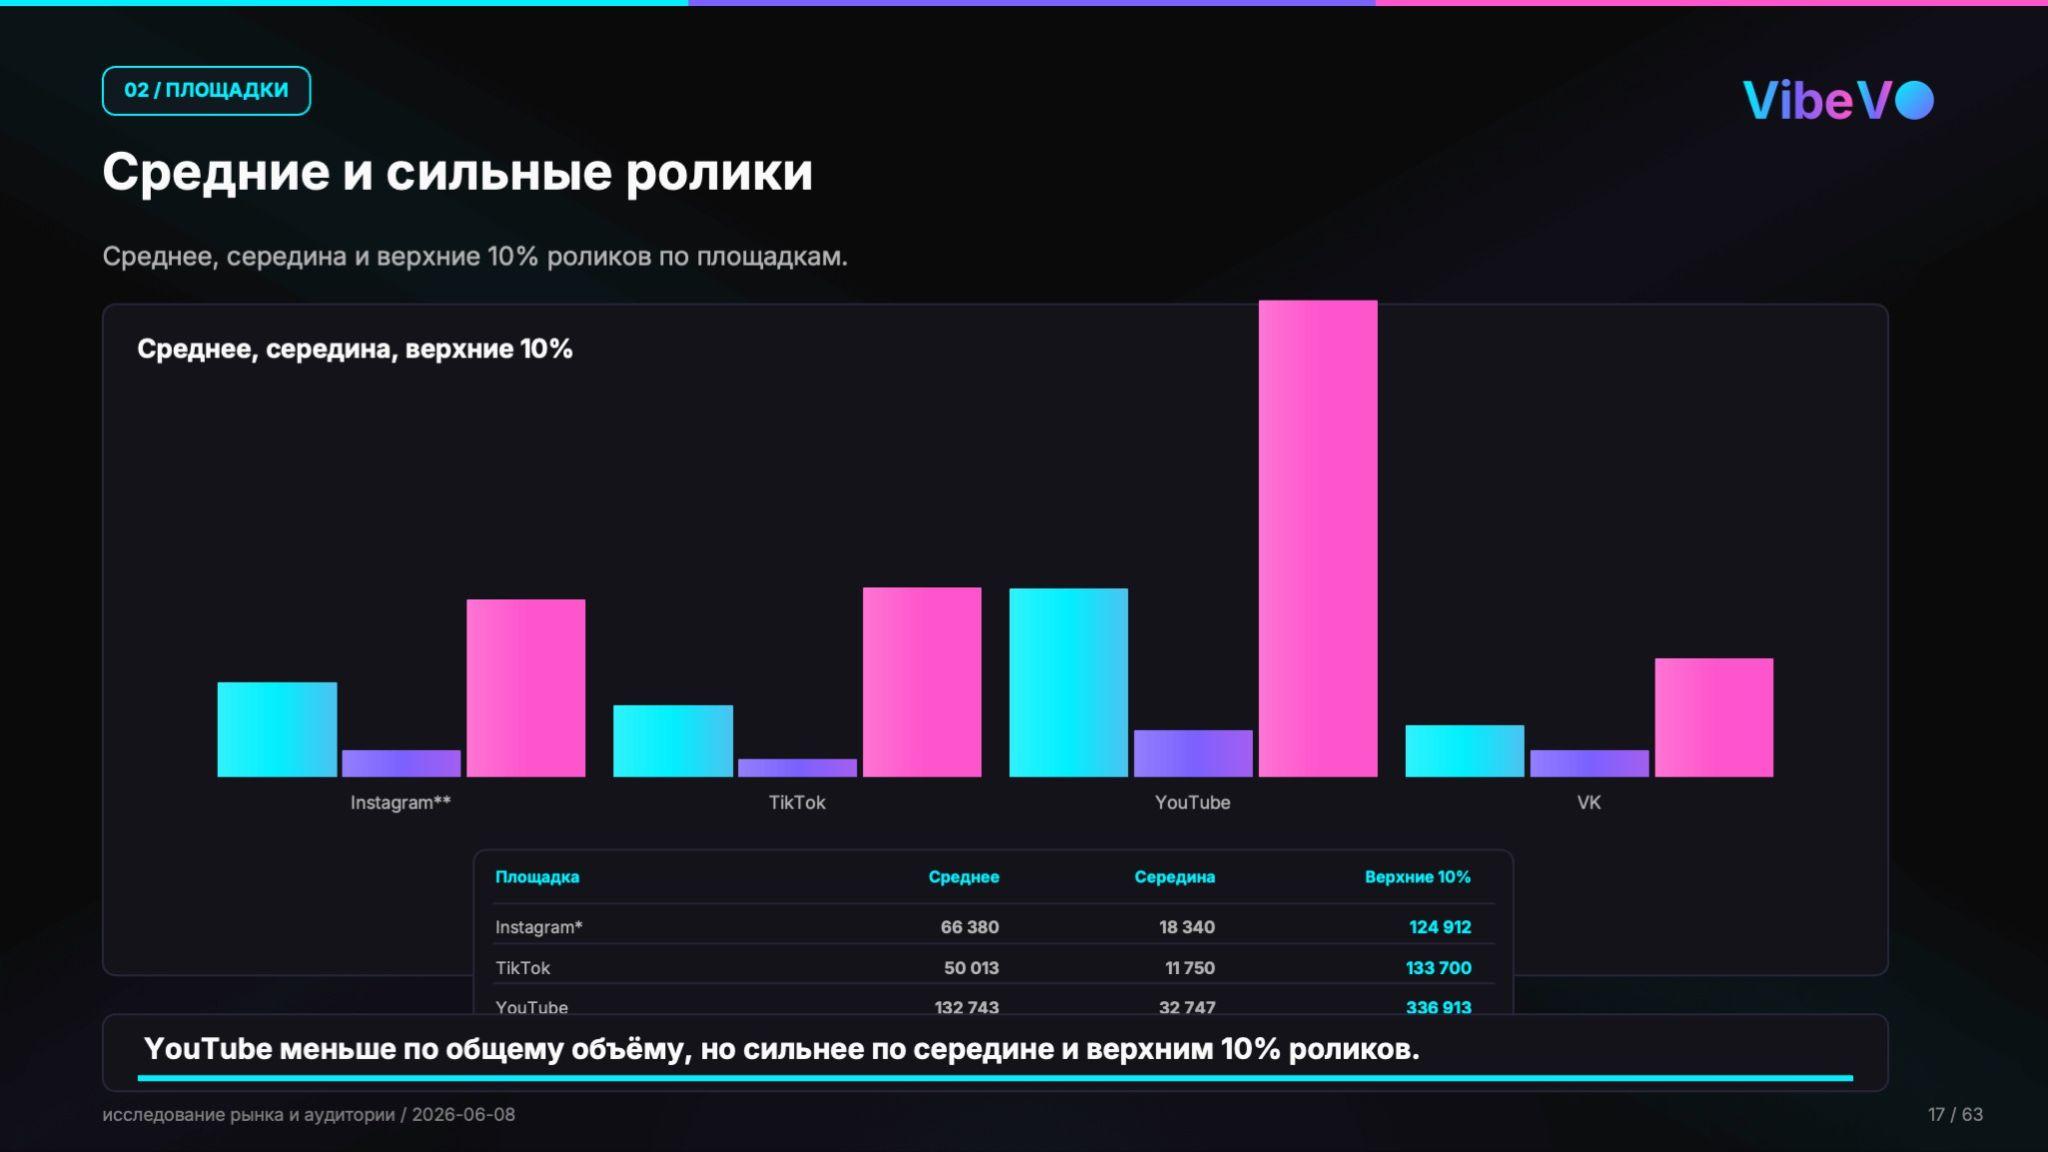
    Instagram* leads in overall volume, but YouTube’s algorithms react more sharply to viral videos and give them a larger share of reach. On average, one video on YouTube received 132,743 views. For Instagram*, the average was 66,380, and for VK, it was 36,277.

    Such a distribution changes the placement plan. Mass reach is logically sought in large Instagram* and TikTok bundles, but if there is viral content, YouTube can be a platform where it is easier to gain reach.

    Illustration 3
    Распределение охватов среди топ 10% самых популярных, медианы и среднее значение по площадкам: YouTube меньше по общему объему, но сильнее по верхним 10%
    Chart 4. Distribution of reach among the top 10% most popular, median and average values by platform: YouTube is smaller in overall volume but stronger in the top 10%.
    Source: VibeVO data, updated 08.06.2026. Click on the chart to open it in full size.

    It is better to analyze topics in bundles: topic plus platform

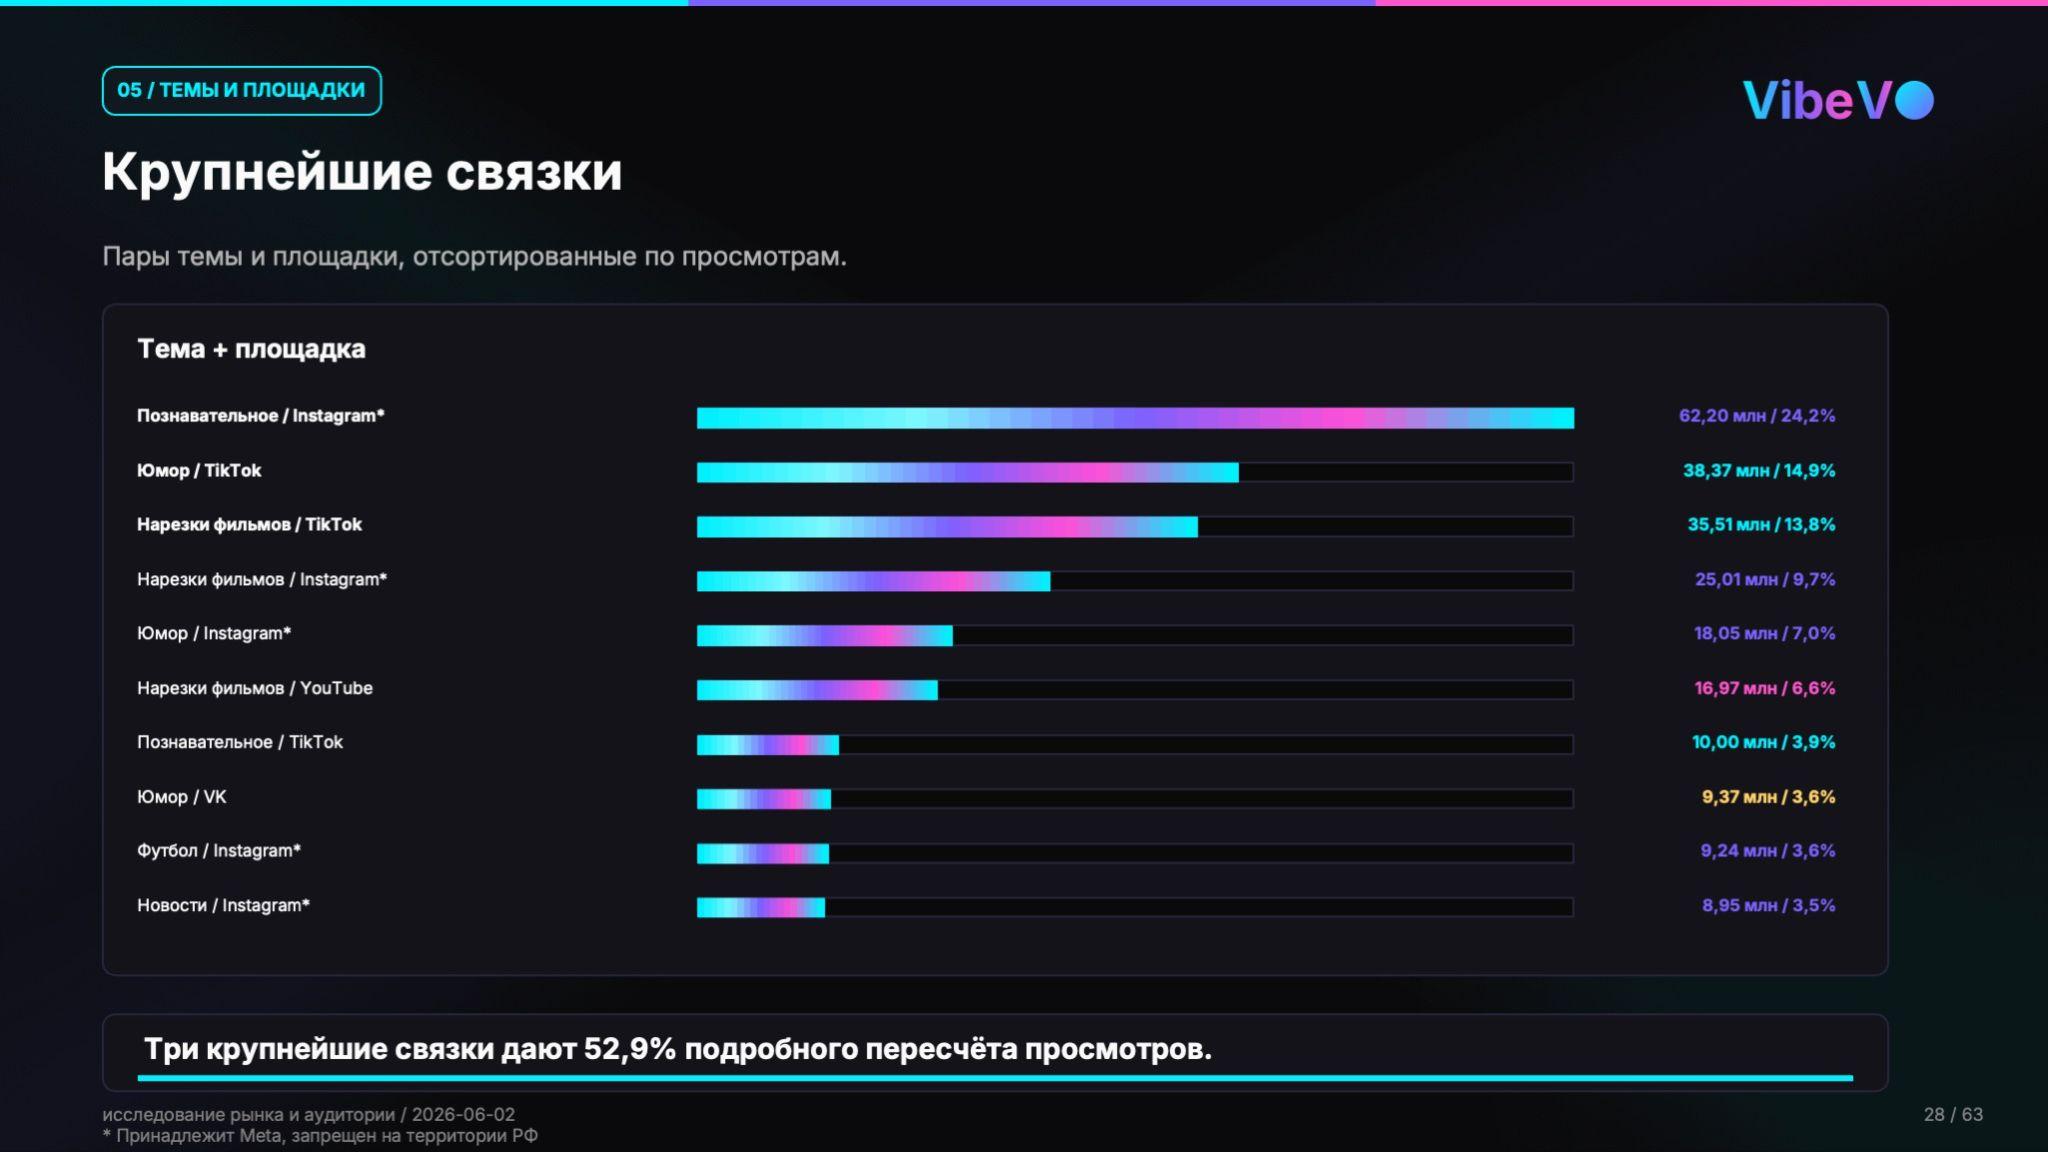
    The total volume across the platform does not fully explain the market. The largest reach points occur where the topic and the distribution medium coincide. In the updated data, the largest combination is educational videos on Instagram*: 62.20 million views, or 24.2% of the detailed recalculation. This is followed by humor on TikTok – 38.37 million views, or 14.9%, and movie clips on TikTok – 35.51 million views, or 13.8%.

    The three largest combinations account for 52.9% of the detailed recalculation of views.

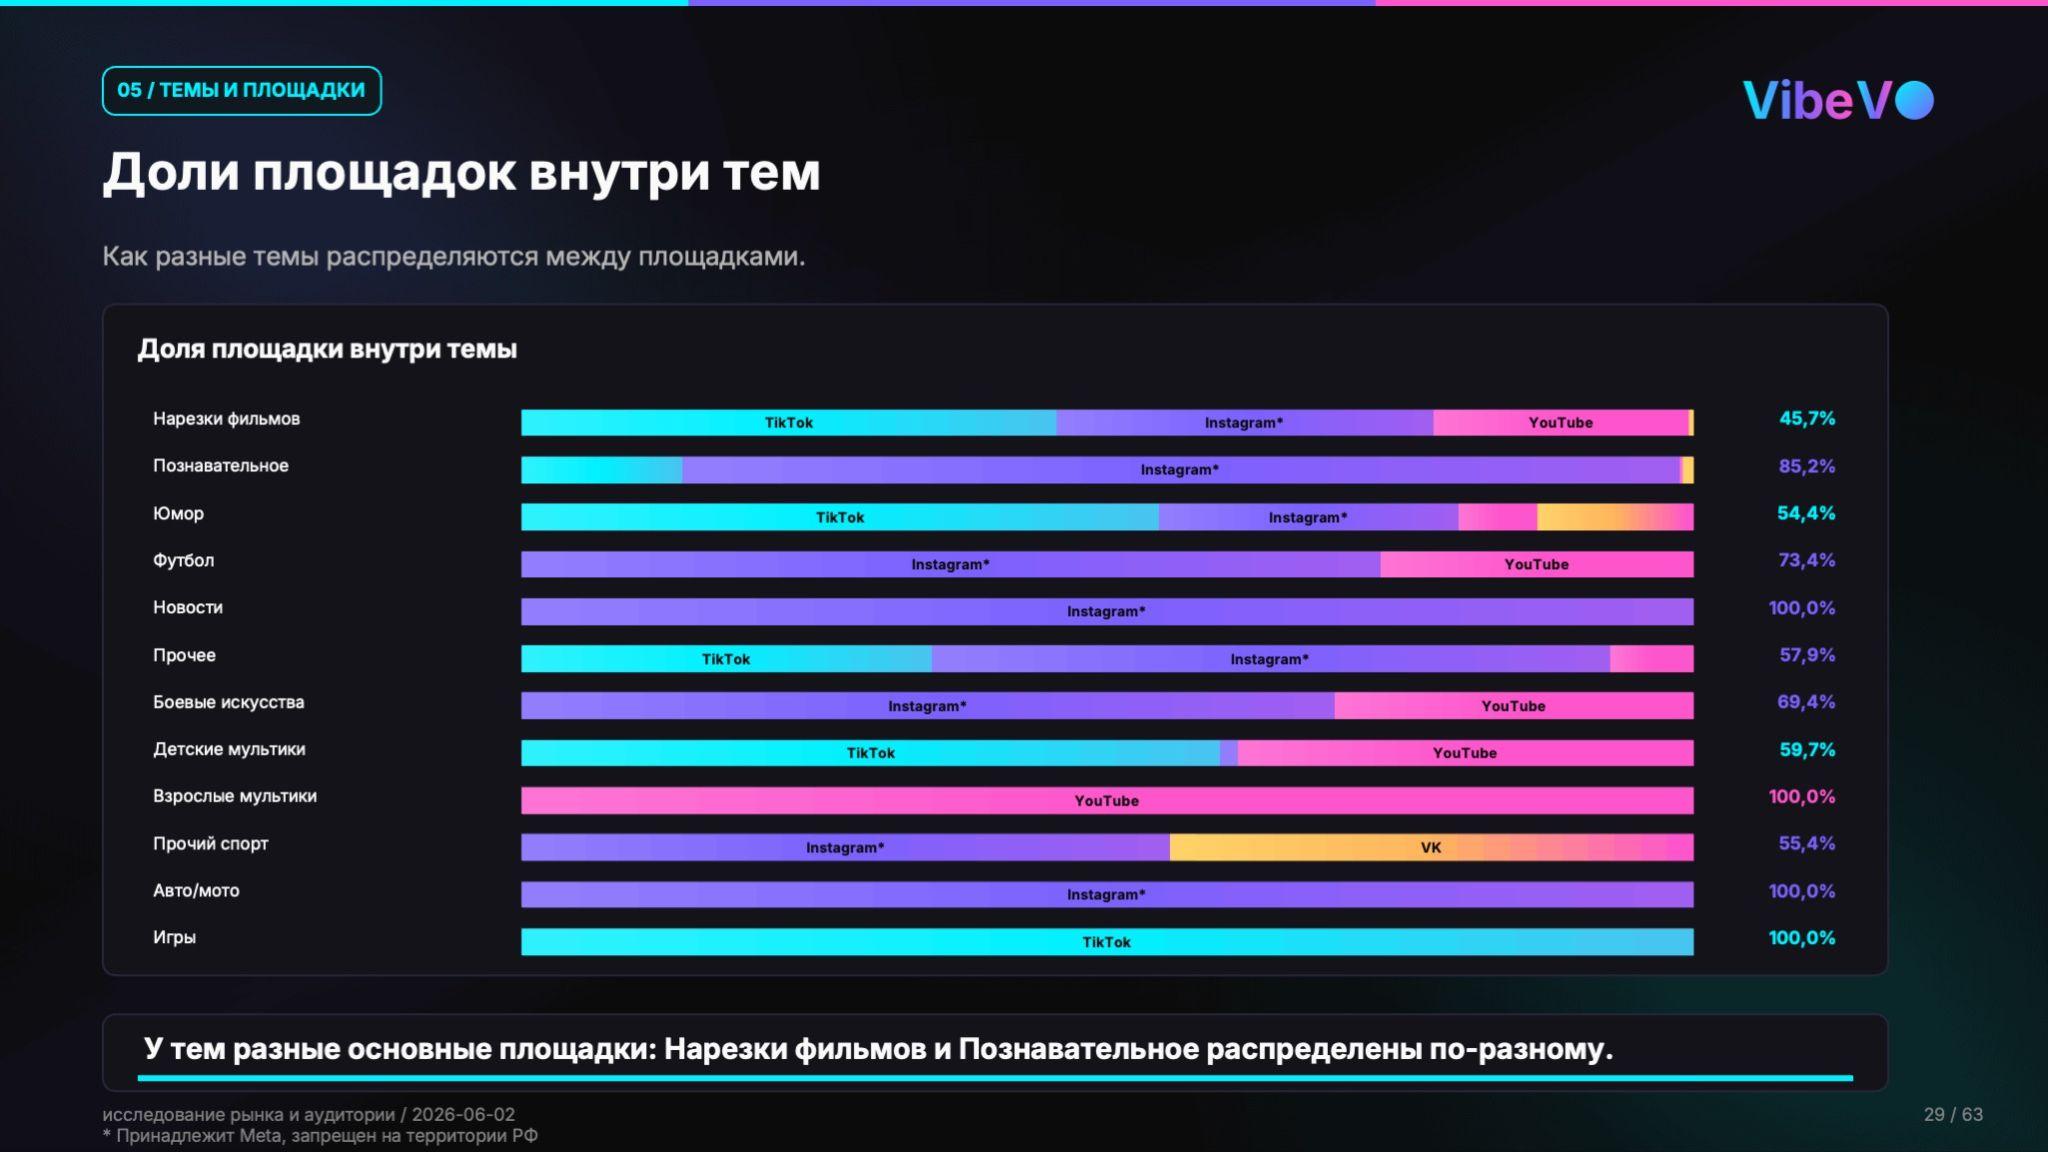
    That is why video clipping cannot be launched using a single general grid for all tasks. For educational videos, auto/moto, Instagram* works better; humor, games, and movie clips rely heavily on TikTok; adult cartoons rely on YouTube. Different topics require different platforms, creators, and designs.

    Illustration 4
    Largest topic and platform combinations: main volume arises from several combinations
    Chart 5. Largest topic and platform combinations: main volume arises from several combinations.
    Source: VibeVO data, updated 08.06.2026. Click on the chart to open it in full size.
    Platform shares within topics: different topics have different main platforms
    Chart 6. Platform shares within topics: different topics have different main platforms.
    Source: VibeVO data, updated 08.06.2026. Click on the chart to open it in full size.

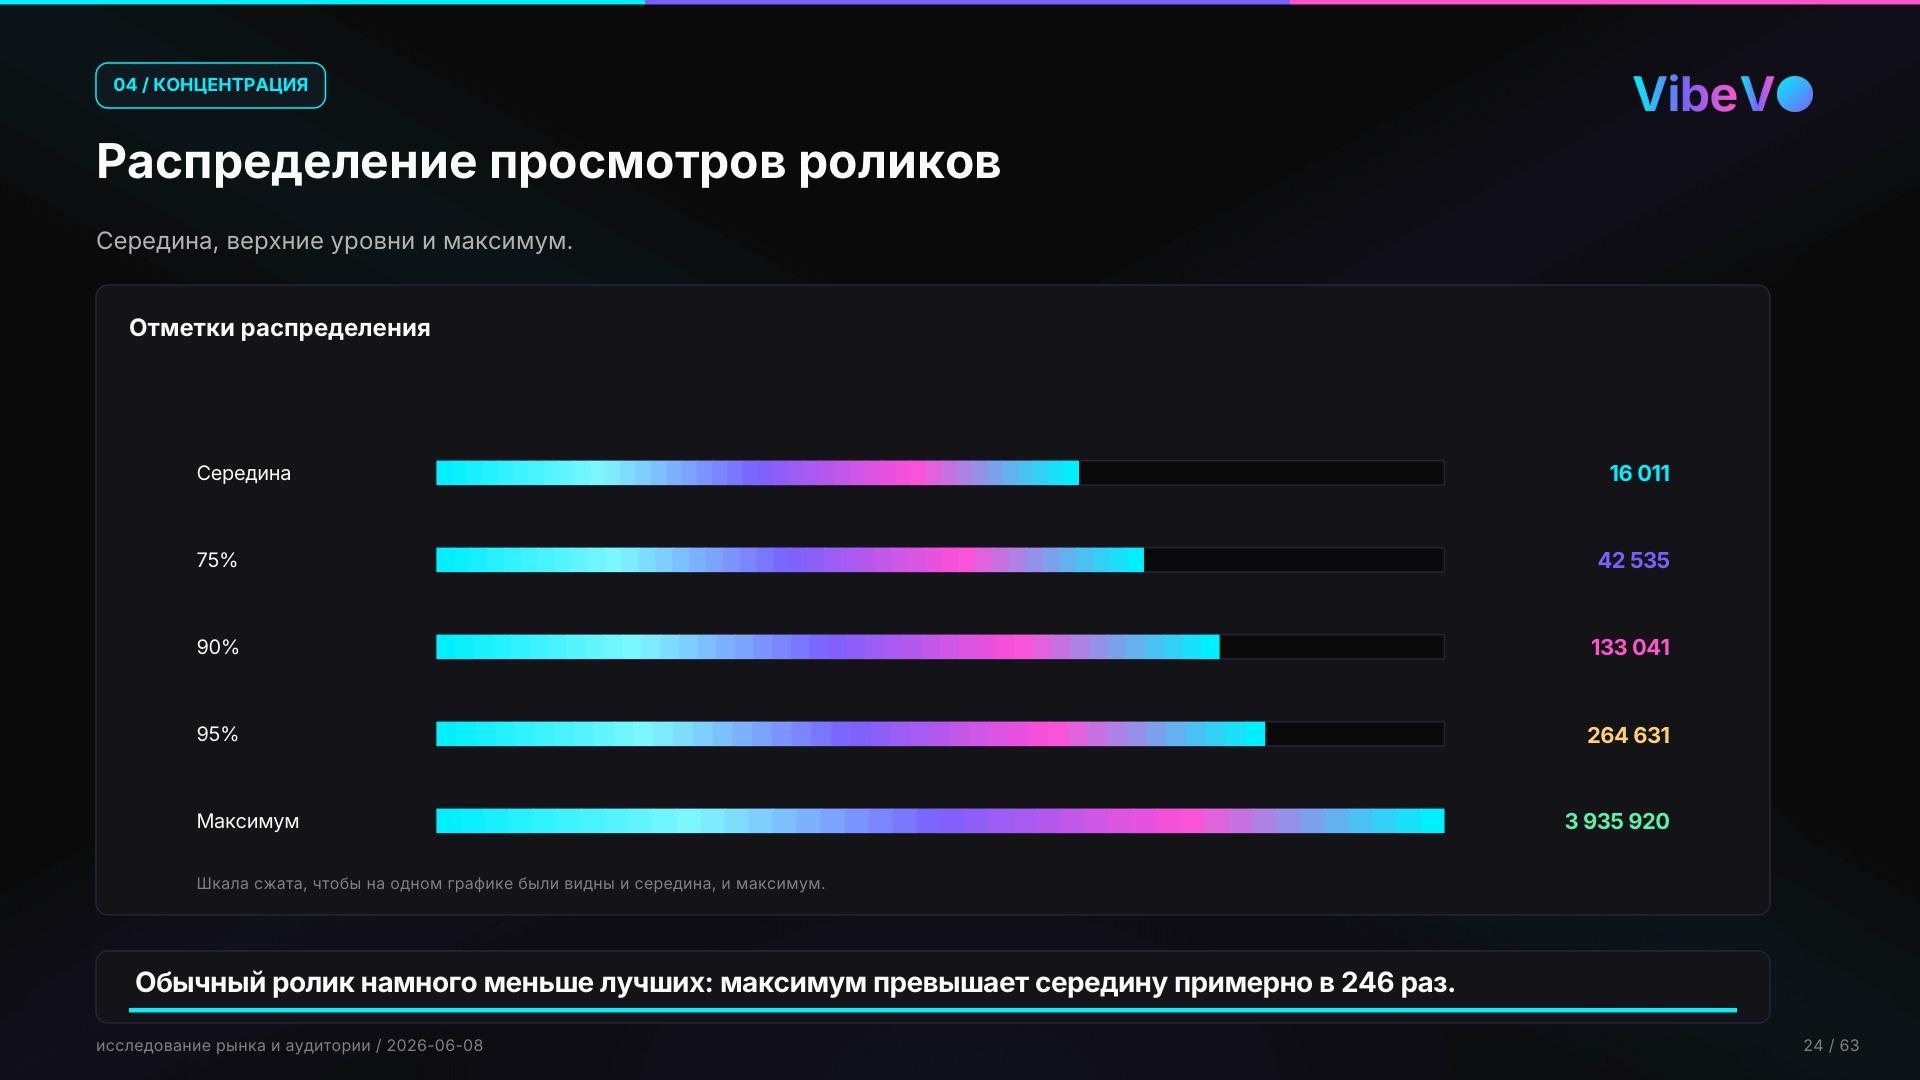
    Views are sharply distributed: the top portion of videos yields results

    In short feeds, the average result hides a very strong unevenness. The average number of views is 16,011 views over 30 days. The 75th percentile is 42,535 views, the 90th percentile is 133,041. The maximum video garnered 3,935,920 views, which is approximately 246 times more than the median. As expected, the distribution is very uneven.

    Even more illustrative is the share of the best publications. The top 10 videos generated 23.88 million views, or 9.3% of the volume. The top 50 videos – 62.48 million, or 24.3%. The top 10% of videos collected 165.54 million views, or 64.3% of all views. In other words, most views are generated by the top 5% of videos.

    A practical conclusion for advertising in video clipping: you cannot rely on a single video. You need a set of video clips with different first seconds, titles, subtitles, overlays, and advertising message options. It’s not just the most beautiful video that wins, but a series of attempts where the best publications quickly gain more weight.